-
Notifications
You must be signed in to change notification settings - Fork 3
CVM H GTL
The various components of the USR, including the topography, basin representations, basement and Moho surfaces, tomographic crust and upper mantle velocity models, and the GTL were as-sembled by parameterizing a set of voxets, or regular grids of voxels, with velocity values and by appropriately resampling sur-faces. These nested voxets include a high-resolution grid (250 by 250 m horizontally, 100 m in depth) centered around the Los Angles basin, where we had the greatest density of data. This voxet was embedded in a medium resolution grid (1 by 1km resolution, 250km in depth) for the remainder of southern California. Areas beyond the extent of the voxets are extrapolated by a 1D ve-locity model (Dreger and Helmberger, 1990; Wald et al., 1995; Hutton et al., 2010). Below 15 km, the model resolution is 1 km vertically and 10 km horizontally.
CVM-H is a cell-based velocity model with three different resultion areas. The LA Basin area is discretized at 250x250mx100m, and the the medium resolution background region is 1kmx1kmx250m resolution. Resolution of model below depth 15km is 10km x 10km by 1km.
The are three CVM-H GTL modes, which include:
- Default - no GTL. The CVM-H model has limited areas with low (<500m/s) Vs values. This is the default mode.
[ucvm@66975967506b target]$ vs30_query -f /app/ucvm/conf/ucvm.conf -m cvmh < vs30pts.txt
 -118.4810    34.3120    165.039
 -118.5000    34.5000   1210.907
 -117.5000    33.5500   1424.097
 -117.5000    35.5000   1458.000
 -116.5000    34.4000   1407.656
- CVM-S4 GTL. Users can edit the UCVM.conf file and set a parameter (cvmh_param=USE_GTL,True). When this is set true, CVM-H will return different material properties for the top cell. The properties it returns are based on data extracted from the CVM-S4 model, which has more detailed GTL information.
[ucvm@66975967506b target]$ vi /app/ucvm/conf/ucvm.conf
[ucvm@66975967506b target]$ vs30_query -f /app/ucvm/conf/ucvm.conf -m cvmh < vs30pts.txt
 -118.4810    34.3120    174.363
 -118.5000    34.5000    404.900
 -117.5000    33.5500    318.913
 -117.5000    35.5000    201.797
 -116.5000    34.4000    232.947
- Adding properties from Ely GTL. Users can add the elygtl to the model on the command line.
[ucvm@66975967506b target]$ vs30_query -f /app/ucvm/conf/ucvm.conf -m cvmh,elygtl:ely < vs30pts.txt
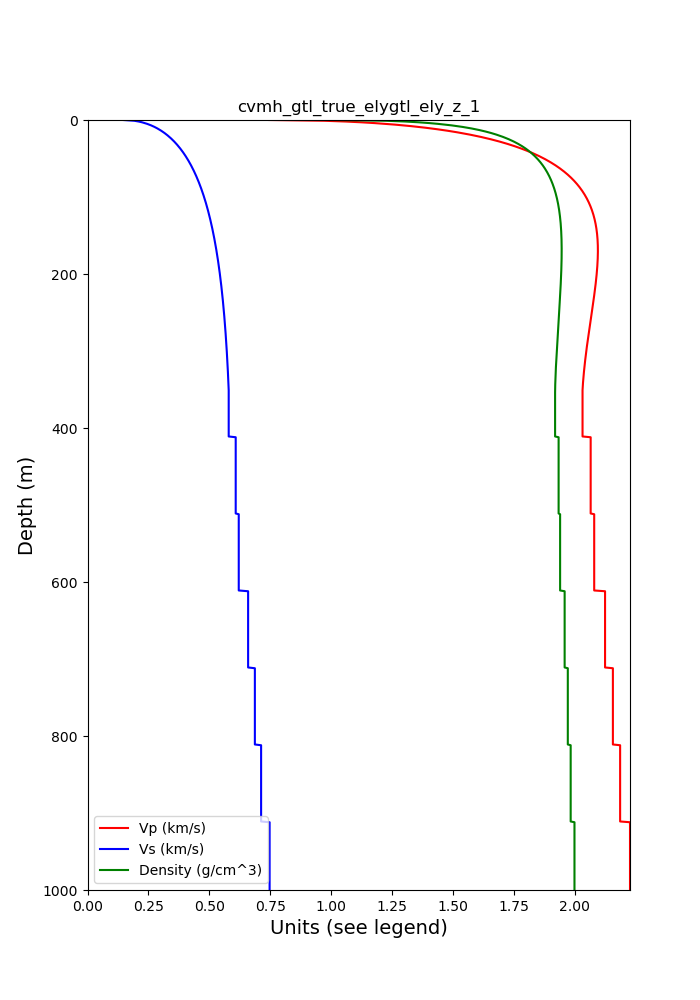
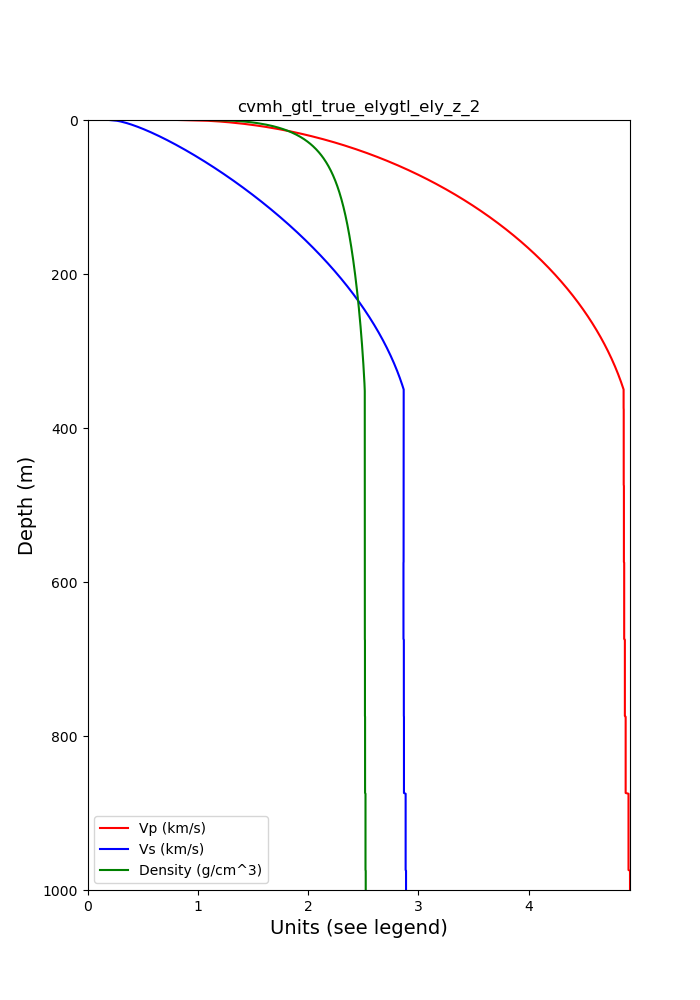
The following vertical profile plots show Vp, Vs, and density changes in the top 1000m using different CVM-H GTL settings. First plot is for a point at USC near downtown Los Angeles within the CVM-H high-resolution model. The second Plot is for a point in the desert area, outside the CVM-H GTL zone
- Latlong for USC
- LAT=34.0224
- LON=-118.2851
- Latlong for Ridgecrest Area
- LAT=35.5
- LON=-117.5
- STEP=1
- START_depth=0
- END_depth=1000

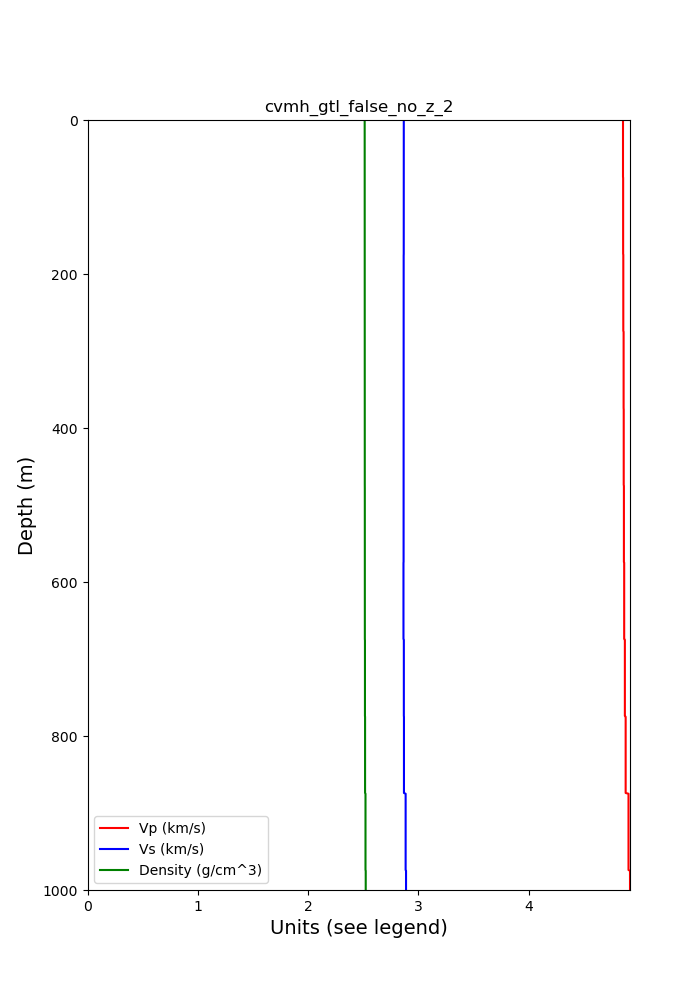
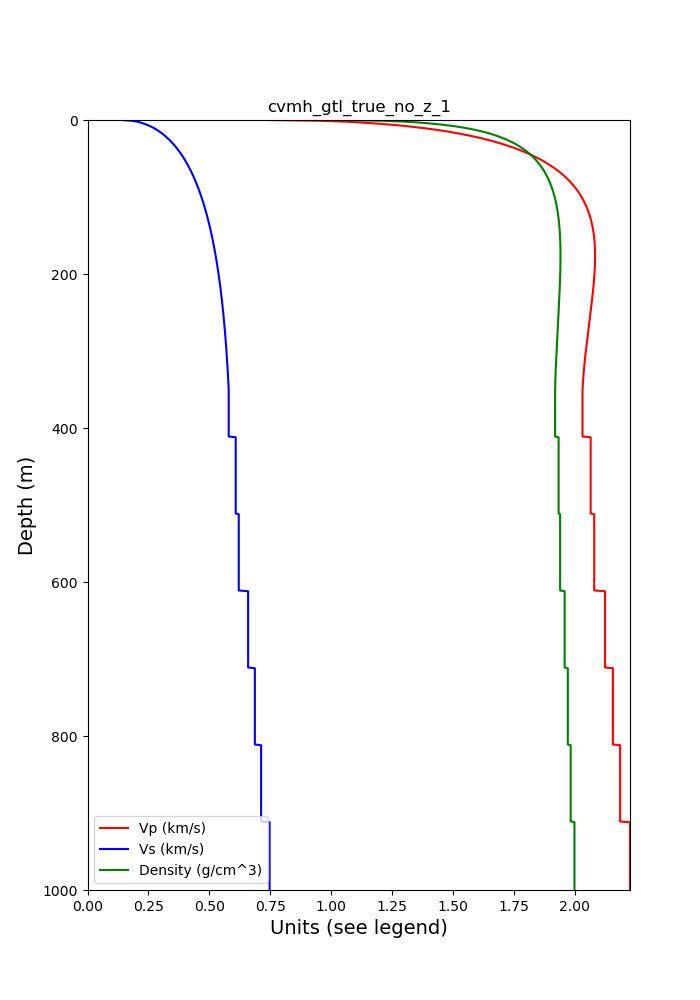
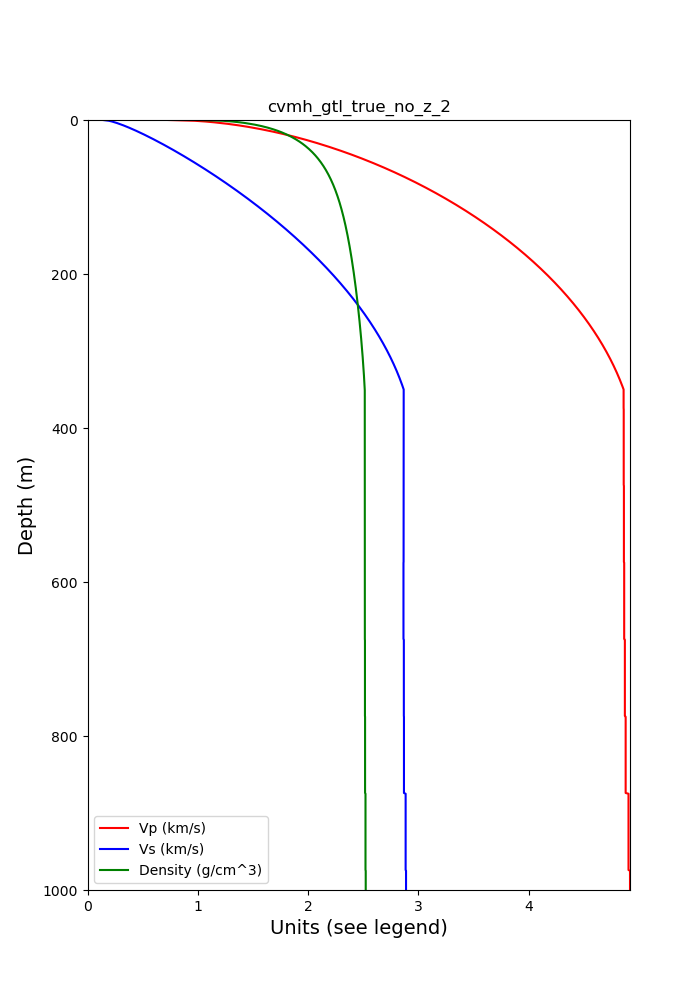

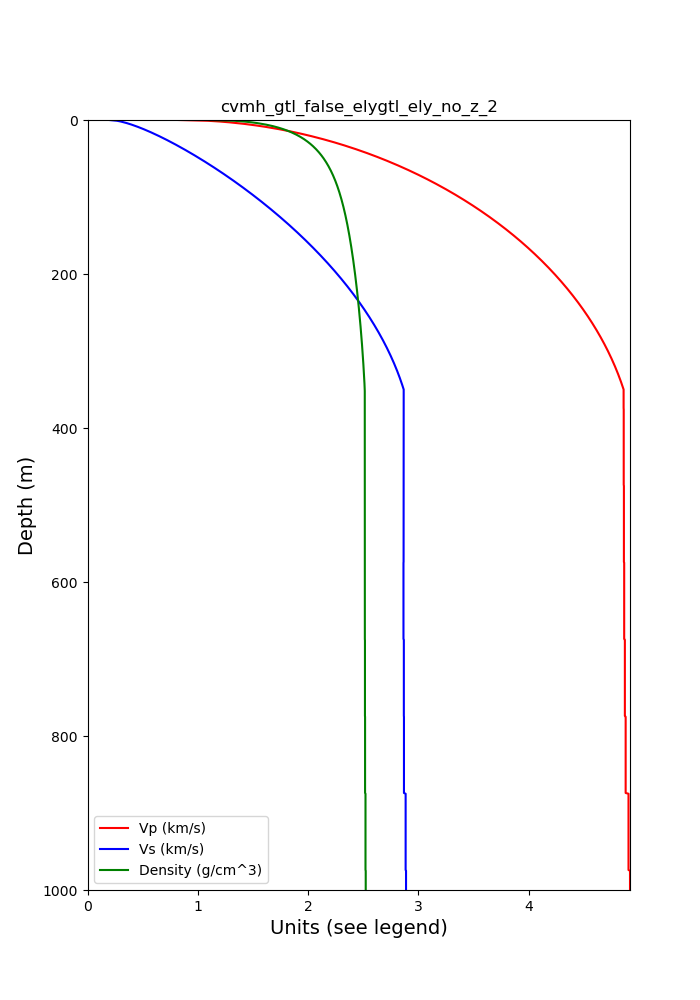


[ucvm@28d7188735e6 target]$ vs30_query -f /app/ucvm/conf/ucvm.conf -m cvms5 < vs30pts.txt
 -118.4810    34.3120    479.035
 -118.5000    34.5000    542.880
 -117.5000    33.5500   1488.633
 -117.5000    35.5000   1301.073
 -116.5000    34.4000   1297.697
[ucvm@28d7188735e6 target]$ vs30_query -f /app/ucvm/conf/ucvm.conf -m cvms5,elygtl:ely -z 0,350 < vs30pts.txt
 -118.4810    34.3120    209.404
 -118.5000    34.5000    276.783
 -117.5000    33.5500    313.116
 -117.5000    35.5000    246.636
 -116.5000    34.4000    200.306
[ucvm@28d7188735e6 target]$ vs30_query -f /app/ucvm/conf/ucvm.conf -m cvms5,elygtl:linear -z 0,350 < vs30pts.txt
 -118.4810    34.3120      0.000
 -118.5000    34.5000      0.000
 -117.5000    33.5500      0.000
 -117.5000    35.5000      0.000
 -116.5000    34.4000      0.000
The user can specify whether a geotechnical layer, based on Ely Vs30 technique is added to the top 300M of the cvm-h model, by editing a flag in the ucvm.conf file. We expect that Vs values in the top 300m will be lower for sites when the USE_GTL flag is set to true. We called ucvm_query this way:
./bin/ucvm_query -f ./conf/ucvm.conf -m cvmh -c gd < ./tests/inputs/ucvm_socal_test_pts.txt > ucvm_cvmh_depth_usegtl_false_results.txt
We ran this query without USE_GTL by setting conf/ucvm.conf file flag this way:
cvmh_param=USE_1D_BKG,False
cvmh_param=USE_GTL,False
We ran this query with USE_GTL by setting conf/ucvm.conf file flag this way:
cvmh_param=USE_1D_BKG,False
cvmh_param=USE_GTL,True
We posted the results on a SCEC Website at:
This shows the the USE_GTL flag return different material properties in the top 500m. However, the columns showing combined results (from model and GTL) are identical. This suggests that the combined properties columns change only when an external GTL is returned from the UCVM. CVM-H internal GTL does not appear as a "combined" material properties, but rather as native model properties.

