Transforming Data
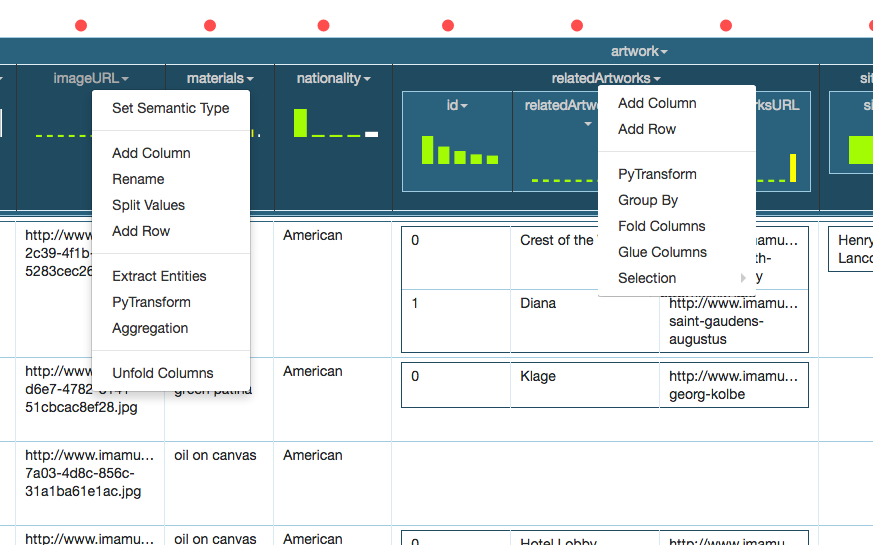
Karma offers various commands to transform the values in cells to create new columns. All options available for a column can be accessed by clicking on the column name as show below. Different options are available for leaf and non-leaf nodes of the Karma worksheet.
-
Add Columnallows to add a new column with a default value -
Renameallows to rename the column -
Split Valuesallows to create a new column or update a column with values that are the result of splitting the data on a delimiter -
Add Rowadds a new empty row to the table -
Extract Entitiesuses StanfordCoreNLP to extract entities from the column and create new columns using the extracted information -
PyTransformallows you to type expressions in Python to define data transformations -
Aggregationallows to aggregate the data based on a pre-defined or user-defined function -
Unfoldallows you to transpose rows into columns -
Foldis the opposite of Unfold and allows to transpose columns into rows -
Glue Columnsallows to combine multiple nested tables into a single one -
Group Byallows to group the data by the selected columns -
Selectionallows to select only a subset of data by running a python function on it.
You invoke both commands from the menu of commands available on all columns:
Clicking on Add Column brings up the following screen:
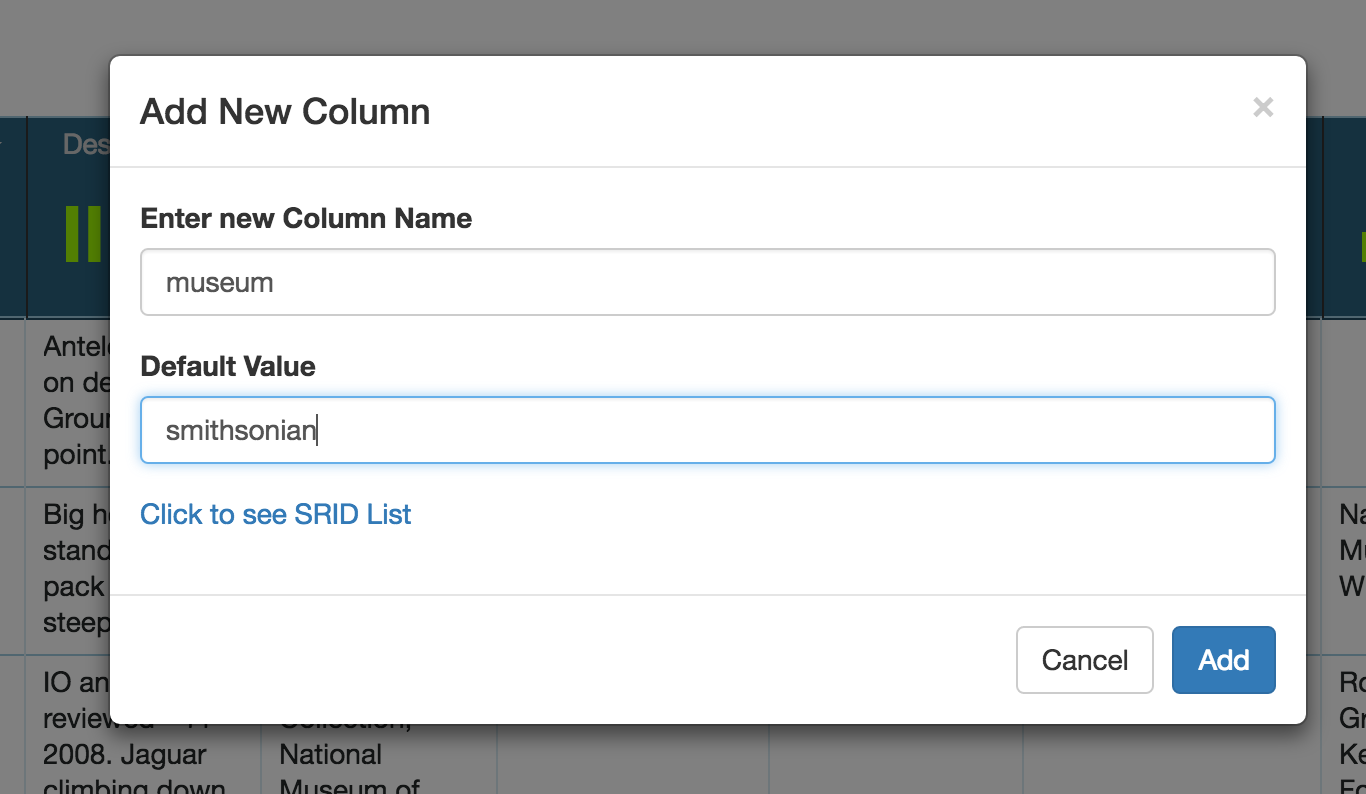
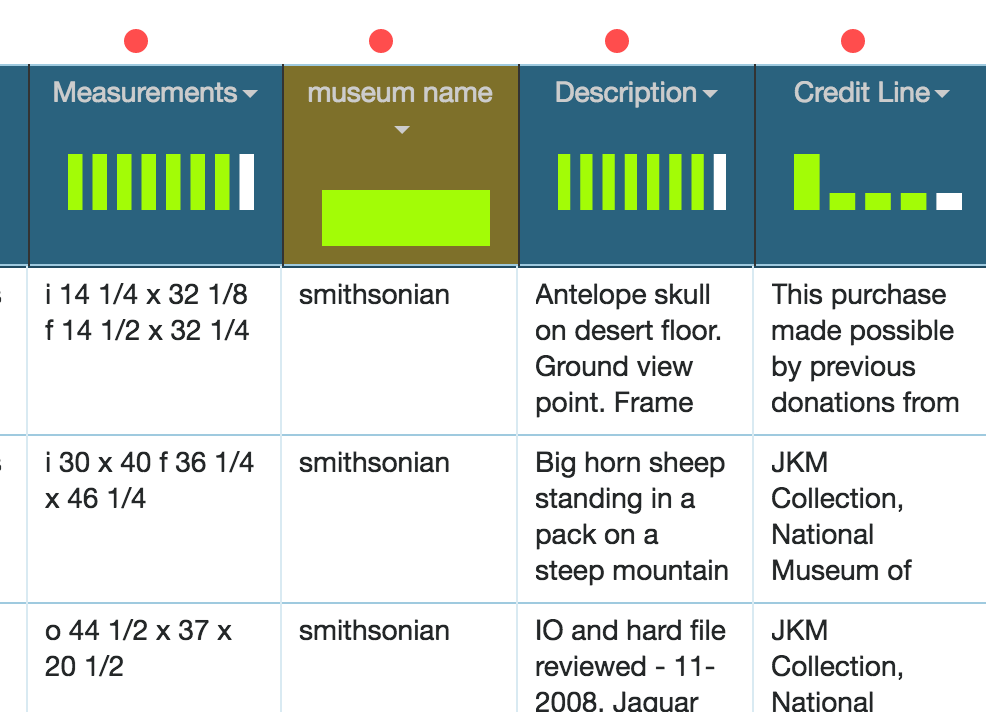
You can enter the name of the column and a default value as shown above and then click Add. It adds a new column as shown below:

As the name suggests, this command renames the column. It brings up the screen shown below that lets you enter the new column name.

Enter the name and click Save.
Clicking on Split Values bring up the following dialog:
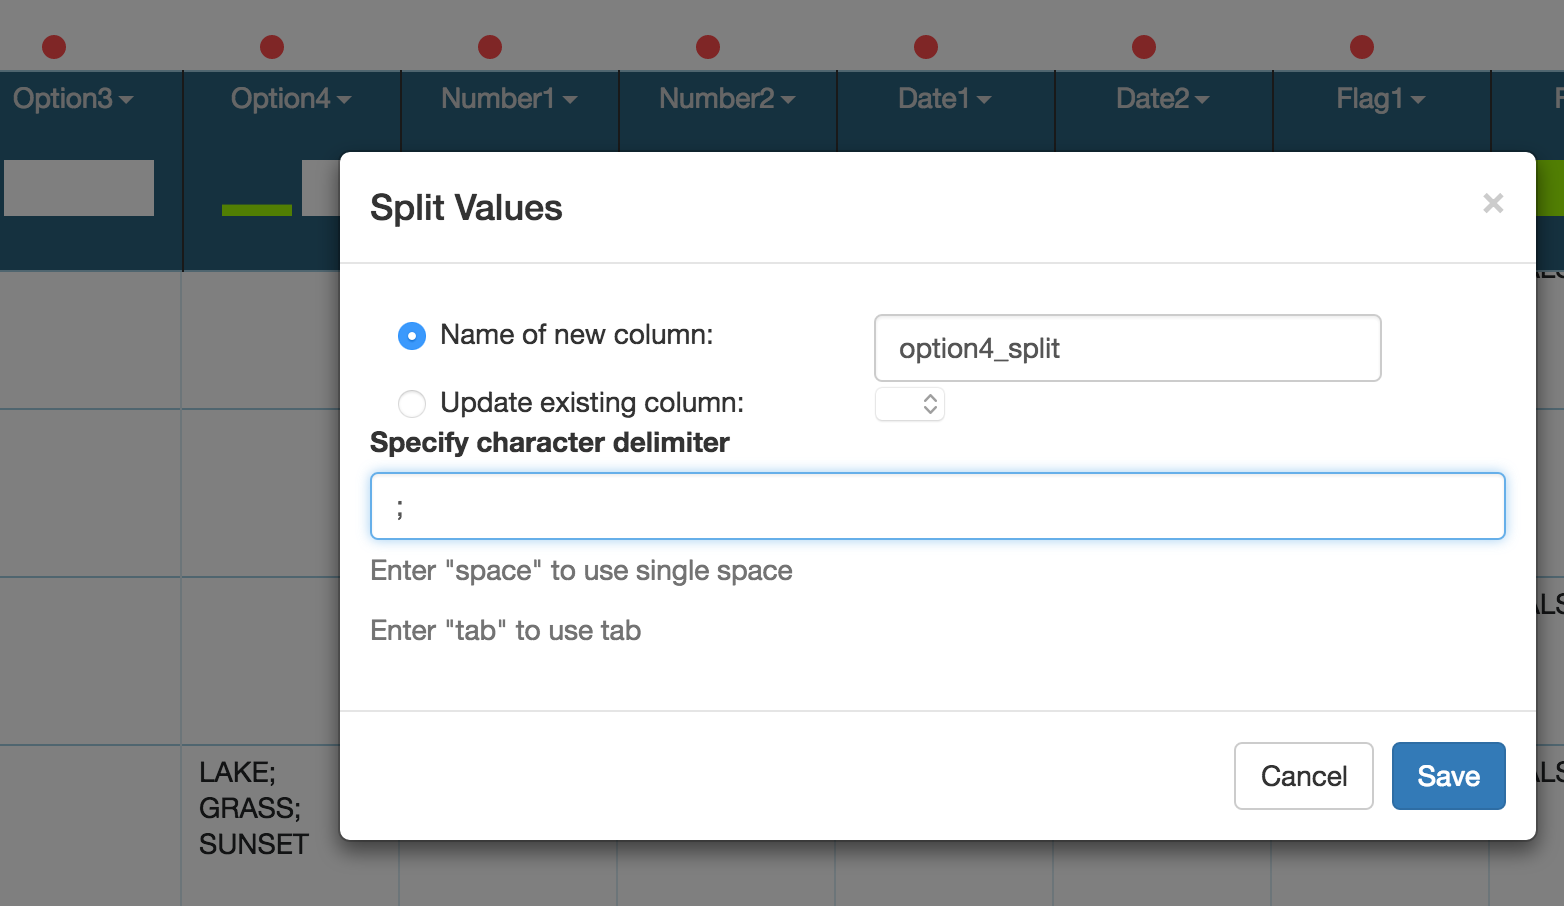
It allows to enter a new column name and select the delimiter. In this case, we want to split the values of Option4 column by semicolon. Below is the output generated after pressing Save:

This transformation allows to extract things like Places, Dates etc using Standford Extraction. Clicking Extract Entities bring up the following dialog that lets you select the capabilities offered by the Service:

In this example, we select Places and Date and click OK. It then extracts the entities and creates a new column for each type of extraction as shown below:

The screenshot below illustrates the use of the PyTransform command.
Suppose you want to transform the Measurements column to extract the measurements of artwork frames. These are the parts of the string following the letter f (e.g., f 14 1/2 x 32 1/4).
You select PyTransform in the menu of the Measurements column, and Karma shows you the following dialogue where you specify how to perform the transformation:
![]()
The main part of the dialogue is the area where you enter your Python code. Here you enter code that specifies how to compute the value of a cell in the new column as a function of the values of the cells in the same row. If you need to add strings with Unicode characters, please append 'u' before the string. 'u' should be outside quotes. For example if you want to replace with "äöABC" then your string should be u"äöABC".
Using the getValue function you can access the value of any cell in a row.
For example getValue("Measurements") gets the value of the cell in the Measurements column.
The sample code in the screenshot above shows how to find the index of the string f and then extract all characters from that index to the end of the string.
You can test your code by clicking on the Preview Results for Top 5 Rows button.
If your code has errors, you can click on the View Errors button to see the errors that the Python interpreter generates for the top 5 rows.
You can access the values of cells in all columns by calling getValue using the name of the column.
For example, you can easily combine the values of two columns, e.g., first and last to create a new column name using the code return getValue("first")+" "+getValue("last").
Hierarchical Sources (e.g., XML or JSON): if your source has nested columns, there is a restriction of which columns you can access using the getValue function
![]()
For example, if you invoke PyTransform on the relatedArtworksTitle column, you can access the value of the id column using getValue("id") because it is in the same nested table as relatedArtworksTitle.
You can access the value of the nationality column using getValue("nationality") because it is in an enclosing table.
Now, if you invoke PyTransform on the nationality, you cannot access the value of the id or relatedArtworksTitle columns because they are in tables one level of nesting deeper than the nationality column. You can, of course, access values in columns at the same level of nationality or above.
getValueFromNestedColumnByIndex can be used to collect values from a column that is not the sibling of column on which we are running the PyTransform
getValueFromNestedColumnByIndex(<ColumnName>, <Path to nested child>, <Index for combining>)
-
<ColumnName>: Name of the column from where to start the traversal -
<Path to nested Child>: Path down from<ColumnName>from where the values should be collected. -
<Index for combining>: If you need the function to copy the same value from the column to all rows of the other column, set this as 0 (or the index of the value to copy) If you need the function to combine the values row-by-row, use the in-built function:getRowIndex()
Here are some examples of getValueFromNestedColumnByIndex function:
- Columns are siblings with the same number in each of the array. In this case we want to iterator over both arrays in the Pytransform.

Click on A/name/values and select ‘PyTransform’. Select “Name of new Column” and enter “combined”. Enter the following as the function: return getValueFromNestedColumnByIndex("A", "note/values", getRowIndex()) + ": " + getValue("values")

- Columns are not direct siblings with different length of arrays (one column has one). In the Pytransform we want to iterate over the large array but keep using the same value from the array of size one.

Click on A/note/values and select ‘PyTransform’. Select “Name of new Column” and enter “combined”. Enter the following as the function: return getValue("values") + ": " + getValueFromNestedColumnByIndex("B", "name/values", 0)

- Columns are not direct siblings with different length of arrays (one column has more than the other). In the Pytransform we want to iterator over both arrays until the smallest array reaches its end and then we can break.

Click on B/name/values and select ‘PyTransform’. Select “Name of new Column” and enter “combined”. Enter the following as the function: return getValueFromNestedColumnByIndex("A", "note/values", getRowIndex()) + ": " + getValue("values")

If you are not familiar with Python, you can learn the basics in a few minutes at http://www.learnpython.org.
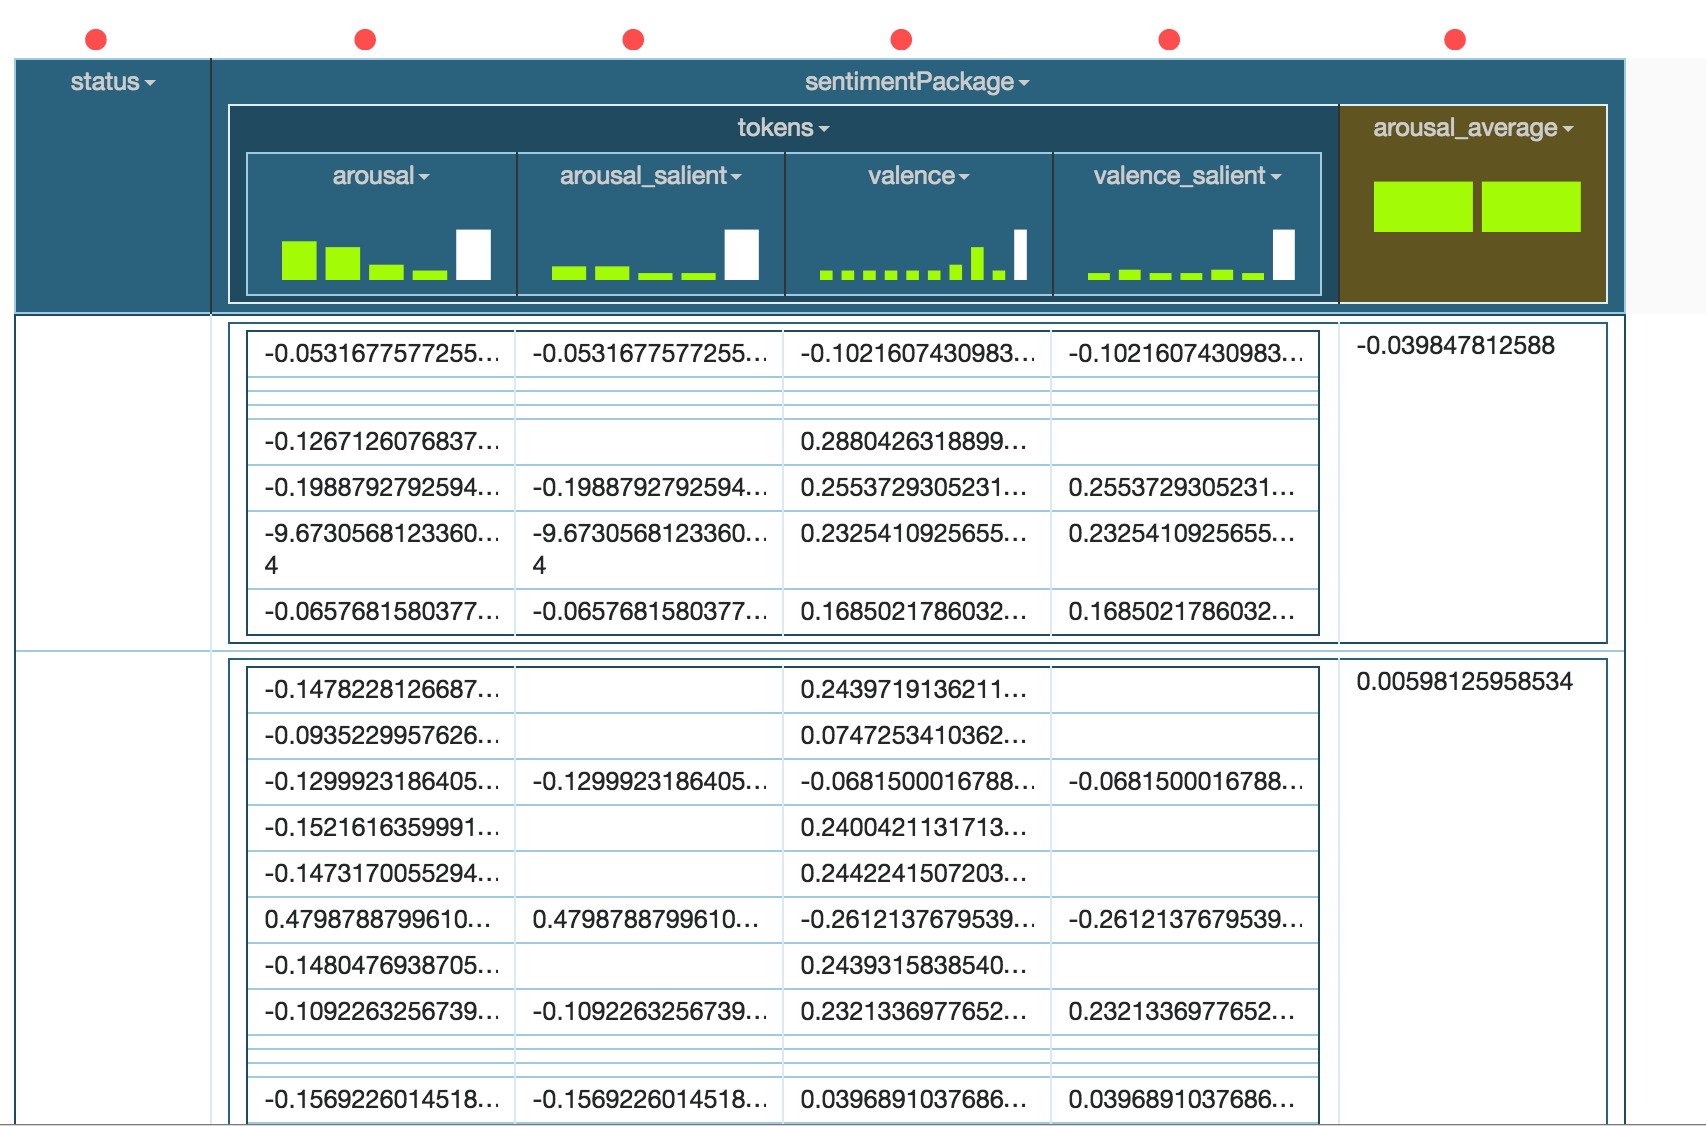
Aggregation allows to aggregate the data based on a pre-defined or user-defined function.
In the following example, there is a nested table with column arousal_salient whose whose values we might want to aggregate, and compute the average of all the values.

Click on arousal_salient and then click on Aggregation.

This bring up the Aggregation dialog:

Give a new name to the column, and change the aggregation function to be average as shown below:

There are other default aggregation functions available (They are defined in karma\python\aggregations.py):
-
concat- concats all the values in the table using the passed delimiter -
average- computes the average of all values in the table -
min- gives the min value of all values in the table -
max- gives the max value of all values in the table
You can also define your own aggregation. They need to be implement a transform, accumulate and getResult function as shown in this example implementation for concat
class concat:
    def __init__(self, column_name, separator):
        self.result = ""
        self.separator = separator
        self.isFirst = True
        self.columnName = column_name

    def transform(self):
        return getValue(self.columnName)

    def accumulate(self, val):
        if self.isFirst:
            self.result += val
            self.isFirst = False
        else:
            self.result += self.separator + val

    def getResult(self):
        return self.result
The output of the average aggregation will be as shown below:
The input dataset could be structured in a way that the column names appear as Row Values as shown in the example below:
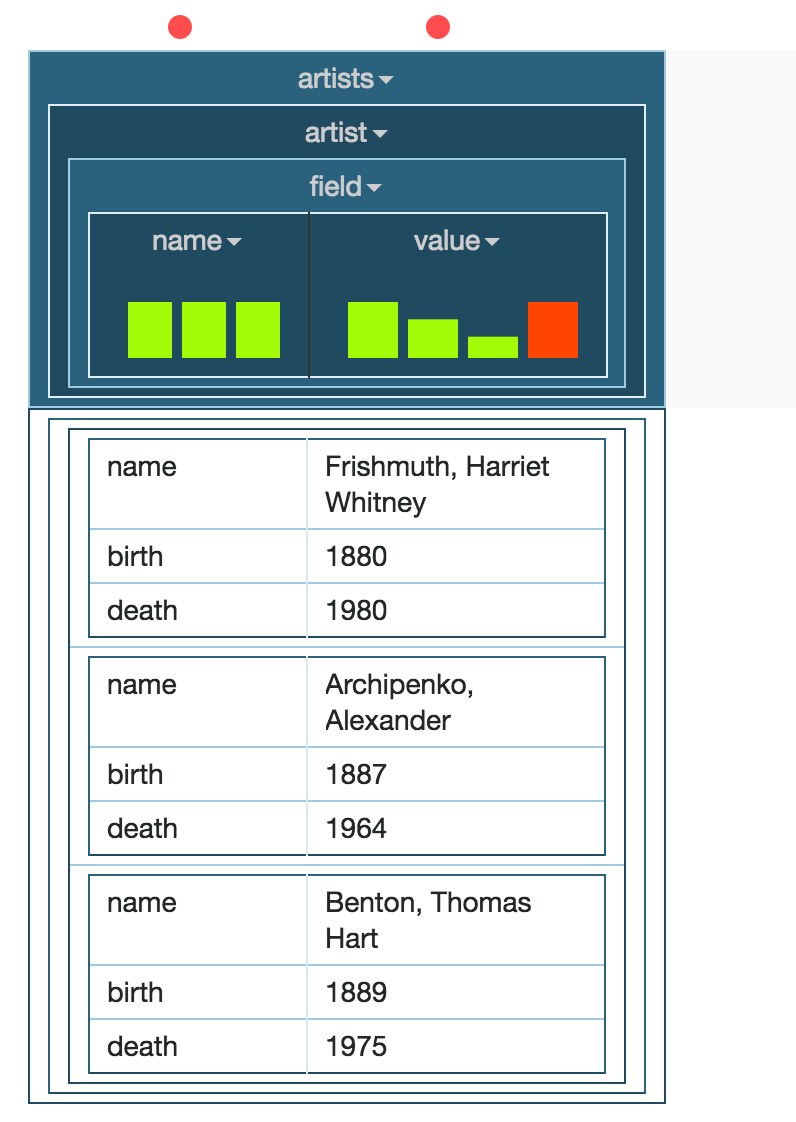
Here the column name contains data that should be the actual column names whose values are in the value column. So we need to transpose the rows into columns. Click on the column that contains the names of the column, in this case, click on name and select Unfold as shown below:

Now, we select the column that contains the values for the Unfolded column, which in this case is value. Select value as shown below and click Submit

This will transpose the rows and produce the following output:

Now we can model the data in Karma. The column name->values is the name of the artist, the column death->values is the death year of the artist and the column birth->values is the birth year of the artist.
Fold Columns command is the opposite of Unfold and transposes columns to rows. In the example shown below, there different codes for countries. Each code is in a different column as shown below:
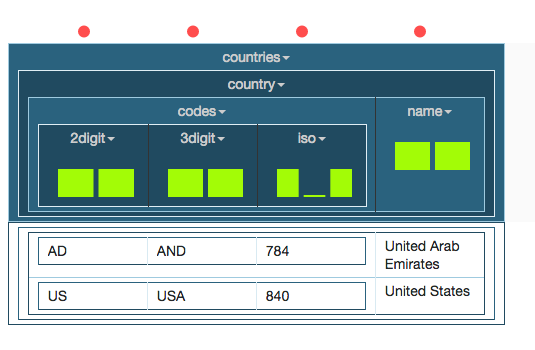
If need need to model them all as code of a Country, we can Fold them into a single column. To do so, click on codes and then select Fold columns as shown below:

Select all columns from the dialog as shown and click Submit:

Karma transposes the columns to rows and below is the resulting worksheet:

Glue columns allows to combine multiple nested tables into a single one
Consider the following worksheet where the addresses are nested into sub-tables:

Click on individual_address and from the menu, click on Glue Columns as shown below:

The menu then shows all the columns under individual_address that we can glue together. In this case, we want to glue the city, state, country and zip-code. Select all these fields as shown below.

The command also allows to configure how the fields should be combined - largest, smallest or Cross Product.
Select largest produces the following result, which is what we need in this example:

Selecting Cross Product does as the name suggests, a cross-product of all values and the result will be as shown below:

Selecting Shortest will generate only as many rows as in the smallest nested table and the result for this example will be as shown below:

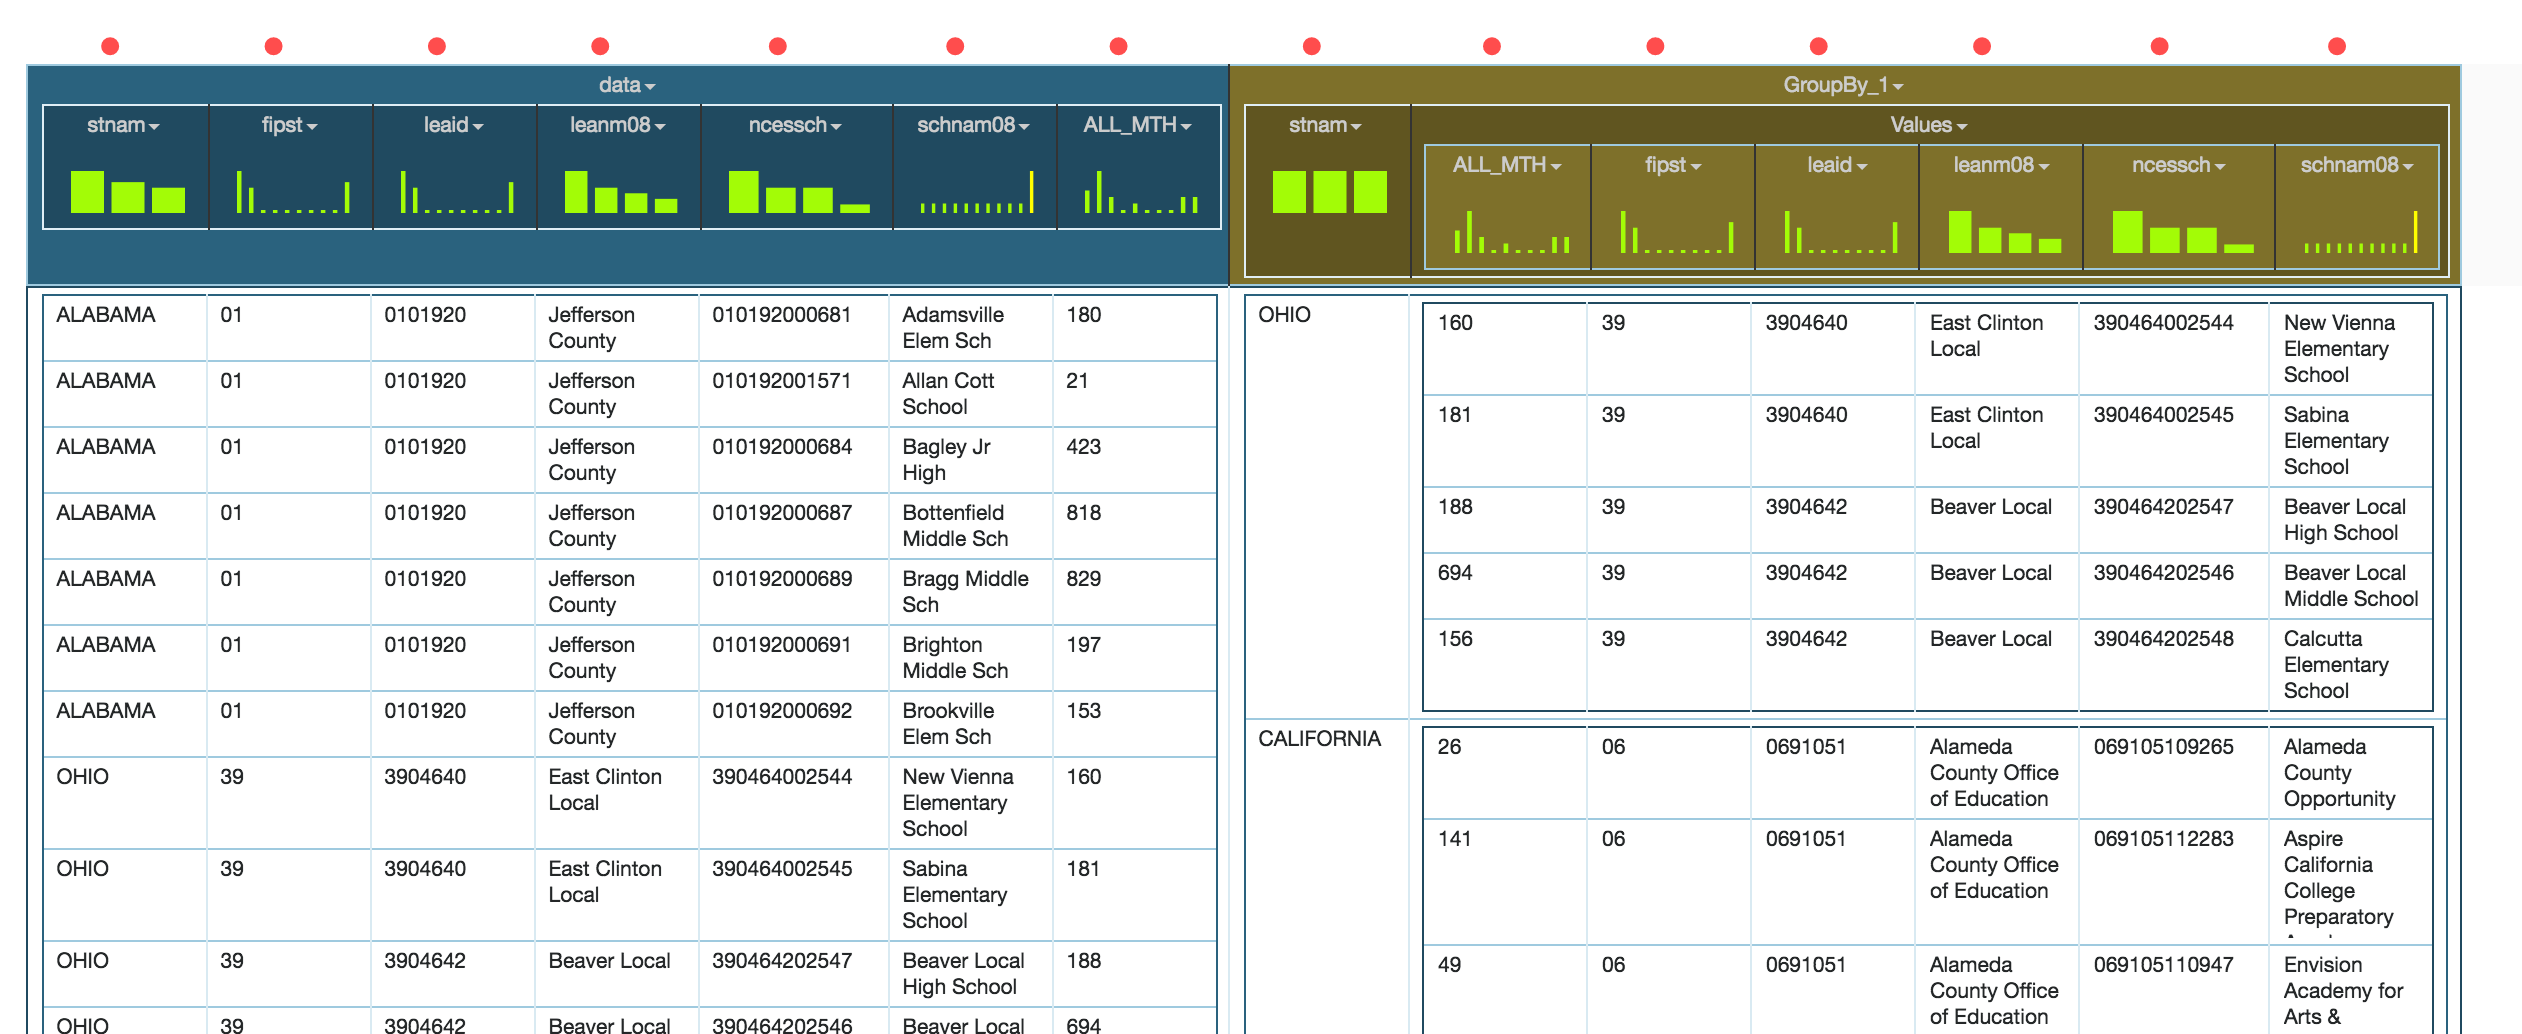
Group By allows to group the data by the selected columns. Consider a dataset contains math scores for all schools in all states as shown below

We may want to compute the average math score per State. For that, we should first group the data by state and then we can use the Aggregation feature to compute the average score per state.
To group the data by State, click on data and then click on the Group By command as shown below
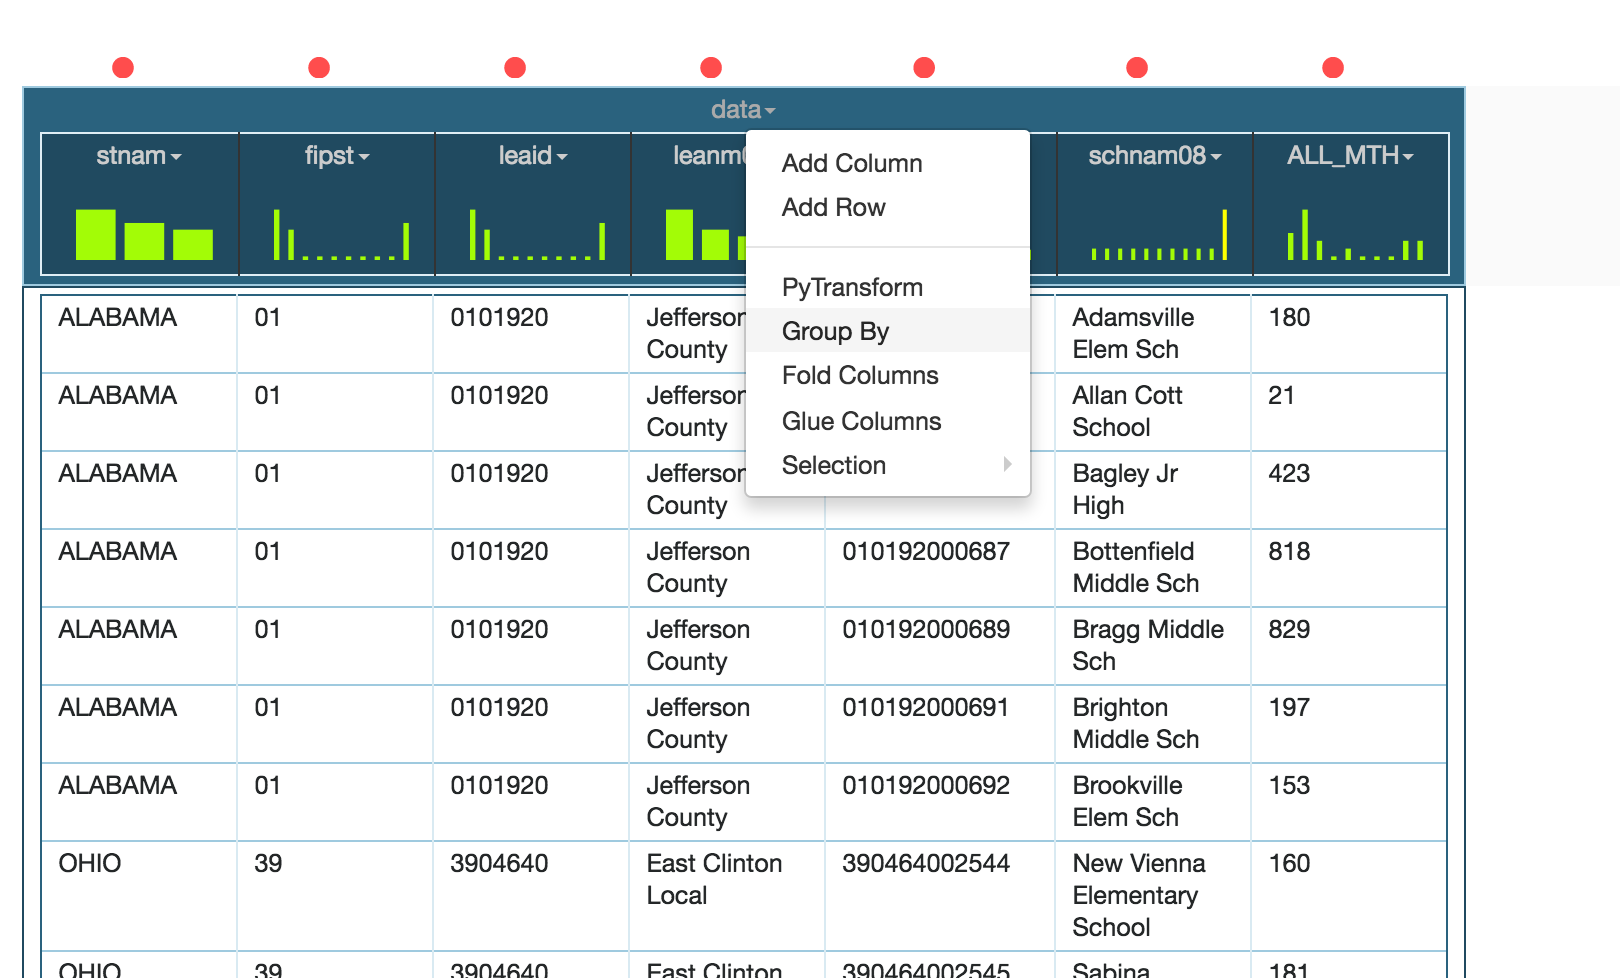
Select stnam column to group the data by only the state name

Click on Submit. This produces the following worksheet:
The data in now grouped by State and we can continue with our transformation for average scores, or anything else that we wish to.
Selection allows to select only a subset of data by running a python function on it.
Consider the following worksheet containing a list of features and their values. We need to model only the phonenumber feature for this dataset

You need to invoke Selection from the top node of a nested table. Since this is a flat worksheet, Selection can be invoked from the Worksheet Menu as shown below.

Click on Selection -> Add Rows. A dialog appears as shown below in which you can enter a statement returning true or false

As shown above, we Select all rows for which the feature_value is not equal to phonenumber. This is because selection works in inverse. As shown in the resulting worksheet, the rows that are enables are white, whereas the rows that are ignored/unselected are grayed out.

After modeling the data as shown above, when we export the JSON-LD, we get the following output:
