-
Notifications
You must be signed in to change notification settings - Fork 19
VERPAT Tutorial Model Description old
Introduction to the VERPAT model and its design.
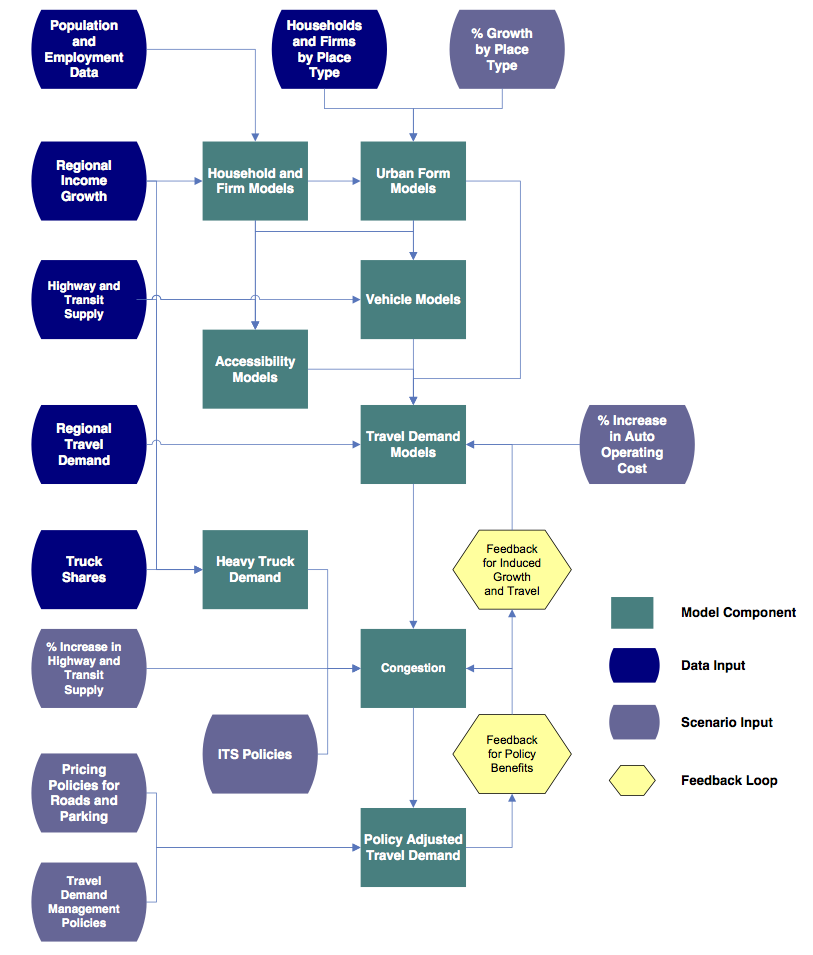
The diagram below illustrates the modeling system with inputs, model components, and feedback loops. Links are provided to the source code that implements each section.
TODO: Check links -- are they correctly associated with bullets?
 |
- Captures individual household and firm characteristics
- Captures interactions between policies
- Spatial results are by place type
For more, see VERPAT Modules and Outputs.
The following is an explanation of the major steps in the model execution shown above.

- Person by Age (from census data)
- Household income (from Bureau of Economic Analysis data)
- Employees
- Industry (from County Business Pattern data)
Data can be updated from local sources

Predicts place types
- Area Types (4)
- Development Patterns (4)
Based on households with
- Working age persons
- Children
- Seniors
Adjusted to fit regional totals
Modules are available in the VELandUse package.
Inputs
- Freeway lane miles
- Transit revenue miles (annual bus and rail revenue miles per capita)
Outputs
- Freeway lane miles per person
- Transit revenue miles per person
Relates both transit and auto accessibility to travel behavior.
Used in vehicle ownership models and vehicle miles traveled models.
Modules are available in the VETransportSupply package.
Predicts number of vehicles for each household
- Autos
- Bikes
- Light trucks
Predicts vehicles by age/fuel efficiency
Based on
- Number of persons of driving age
- Elderly persons
- Household income
- Population density
- Freeway and transit supply
- Urban mixed-use area
Modules are available in the VEHouseholdVehicles package.
Predicts vehicle miles traveled for each household
- Autos and light trucks
- Heavy trucks
- Buses and passenger rail
Based on
- Household income
- Population density
- Number of household vehicles
- Freeway and transit supply
- Driving age persons in household
- Elderly persons in household
- Mixed use development
Truck VMT is based on changes in regional household income
Bus VMT is calculated from bus revenue miles
Modules are available in the VEHouseholdTravel package.
Three aspects are represented:
- VMT is allocated to freeways and arterials by congestion level
- Speeds and fuel economies are calculated for freeways and arterials
- Congestion in local areas is estimated from increased activity
Congestion is part of a feedback loop between changes in each scenario and induced growth
Modules are available in the VETransportSupplyUse package.
Definition: Additional demand resulting from adding transportation supply
Short term -- induced demand
- Changes in road supply, function of speed
- Potential mode and route shift
Long term -- induced growth: changes in growth patterns resulting from changes in travel patterns
Induced demand is calculated in the VEHouseholdTravel package.
TODO introduce bullet points
Direct travel impacts
- Daily VMT
- Daily vehicle trips
- Daily transity trips
- Peak travel speeds by facility type
- Vehicle hours of travel
- Vehicle hours of delay
Community impacts
- Public health impacts and costs
- Equity impacts
Environment and energy impacts
- Fuel consumption
- Greenhouse gas emissions
- Criteria emissions
Financial and economic impacts
- Regional highway infrastructure costs
- Regional transity infrastructure and operating costs
- Annual traveler cost
Land market and location impacts
- Regional accessibility
Performance metrics are calculated in the VEReports package. For more information, also see VERPAT Modules and Outputs.
- Getting Started
- VisionEval Models
- VERPAT Tutorial
- VERSPM Tutorial
- VE-RSPM Training
- Developer Orientation
- Goals and Objectives
- Working Together
- Automated Testing
- Contribution Review Criteria
- Modules and Packages
- Development Roadmap
- Documentation Plan
- Multiple Scenarios