-
Notifications
You must be signed in to change notification settings - Fork 21
Profilers Chain
The meaning of Profilers Chain is the feature that profilers are linked together and are run. By the way, the name of "Profilers Chain", I called it arbitrarily, so it might have real name. I'll be waiting for anyone's suggestion about that 😘
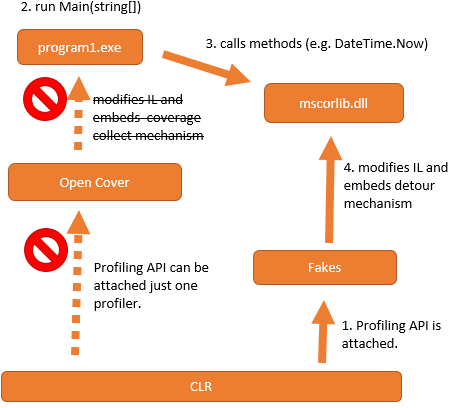
You may think that "Are there any situation that links profilers together?". In the .NET Framework, there is a timing modifying IL dynamically, but it is only one, the JIT that is provided by Profiling API. Therefore, the development tools - embedding a certain measuring instrument or framework when a program is run - inevitably gather for purpose of it. To detect its memory leak, to measure its performance, to help its debugging by trace log insertion, to actualize Edit and Continue by embed script, and so on.
Problem comes by a combination of them. By the design of Profiling API, the profilers that can attach to a process are chosen only one automatically. For example, if you use any mocking tools - my Prig, Microsoft Fakes, Typemock Isolator, Telerik JustMock, and so on - which based on Profiling API in combination with any coverage measurement tools - NCover, OpenCover, JetBrains dotCover, and so on - which also based on Profiling API, you probably fall into the problem of "I can use Test Double, but I can't measure the code coverage 😢 " or "I can measure the code coverage, but I can't use Test Double 😢 ".

For this reason, if you'll create something based on Profiling API, I recommended that you consider whether the feature which transparently calls I/F for the API if any tools using the API has already attached is necessary or not.

Of course Prig supports this feature because I promote Prig as open source alternative to Microsoft Fakes 😏 Let me introduce an example to use Prig in combination with the OSS coverage measurement tool OpenCover against IsTodayHoliday example in Generics.
At first, install NUnit runner as a target package of Prig. Execute the follows command in the Package Manager Console:
PM> prig install NUnit -source (Resolve-Path .\packages\NUnit.Runners.2.6.4\tools).PathI can do-nothing about the many arguments for OpenCover, but you might understand a bit easier by making runtests.bat as this article:
prig run -process ".\packages\nunit.Runners.2.6.4\tools\nunit-console.exe" -arguments ".\ProfilersChainTest\bin\Debug\ProfilersChainTest.dll /domain=None /framework=v4.0"
Prig requires some environment variables to attach such nested program. In addition, we can't read the result of OpenCover directly, so we usually use ReportGenerator and format it. Therefore, I recommend to gather the above steps to the script runcoverages.ps1 as follows:
# Set working directory for Prig.
$env:URASANDESU_PRIG_CURRENT_DIRECTORY = (Resolve-Path .\ProfilersChainTest\bin\Debug).Path

# Set the target process name that Prig should attach.
$env:URASANDESU_PRIG_TARGET_PROCESS_NAME = "nunit-agent"

# Run tests with OpenCover.
& (Resolve-Path .\packages\OpenCover.*\OpenCover.Console.exe).Path -target:runtests.bat -filter:+[ProfilersChain]* -register:user

# Format the result by ReportGenerator.
& (Resolve-Path .\packages\ReportGenerator.*\tools\ReportGenerator.exe).Path -reports:results.xml -targetdir:coverage
Then, let's run it from the Package Manager Console:
PM>  & .\runcoverages.ps1
Executing: C:\Users\User\Prig.Samples\07.ProfilersChain\runtests.bat

C:\Users\User\Prig.Samples\07.ProfilersChain>prig run -process ".\packages\nunit.Runners.2.6.4\tools\nunit-console.exe" -arguments ".\ProfilersChainTest\bin\Debug\ProfilersChainTest.dll /domain=None /framew
ork=v4.0"
NUnit-Console version 2.6.4.14350
Copyright (C) 2002-2012 Charlie Poole.
Copyright (C) 2002-2004 James W. Newkirk, Michael C. Two, Alexei A. Vorontsov.
Copyright (C) 2000-2002 Philip Craig.
All Rights Reserved.

Runtime Environment -
   OS Version: Microsoft Windows NT 6.2.9200.0
  CLR Version: 2.0.50727.8009 ( Net 3.5 )

ProcessModel: Default    DomainUsage: None
Execution Runtime: v4.0
........................
Tests run: 24, Errors: 0, Failures: 0, Inconclusive: 0, Time: 4.054704275785 seconds
  Not run: 0, Invalid: 0, Ignored: 0, Skipped: 0

Committing...
Visited Classes 1 of 1 (100)
Visited Methods 1 of 1 (100)
Visited Points 13 of 13 (100)
Visited Branches 25 of 25 (100)

==== Alternative Results (includes all methods including those without corresponding source) ====
Alternative Visited Classes 1 of 1 (100)
Alternative Visited Methods 1 of 1 (100)
Loading report 'C:\Users\User\Prig.Samples\07.ProfilersChain\results.xml'
 Preprocessing report
 Initiating parser for OpenCover
  Current Assembly: ProfilersChain
Initializing report builders for report types: Html
Analyzing 1 classes
 Creating report 1/1 (Assembly: ProfilersChain, Class: ProfilersChain.LifeInfo)
 Creating summary
Report generation took 0.6 seconds
PM>
The latest results are the below:
You was able to confirm to get C0/C1 coverage 100%! You can perform refactoring without any hesitations. You can modify it to the code that has easy maintainability whatever you want! Woo-Hoo!!! 👯
By the way, I'm lamenting that this feature was excluded when Microsoft Fakes was equipped standardly in Visual Studio, because it was equipped in the era of previous product Moles. I can understand that Microsoft want to impound customers by own products, but... 👿
-
Home
- QUICK TOUR [SRC]
- FEATURES
- CHEAT SHEET
- PACKAGE MANAGER CONSOLE POWERSHELL REFERENCE
- COMMAND LINE REFERENCE
- APPVEYOR SUPPORT
- MIGRATION
- From Microsoft Research Moles [SRC]
- From Microsoft Fakes [SRC]
- From Telerik JustMock [SRC]
- From Typemock Isolator [SRC]

