-
Notifications
You must be signed in to change notification settings - Fork 75
Performance Java 7
Last versions no located as following
See orm-benchmarks for benchmark sources and results.
The introduction of log4j in the pom impacted the hibernate benchmark, I replace the last run number with a previous run.
Notes. the last update see a change in the pattern in the results, it might be due to a change of config on my machine.
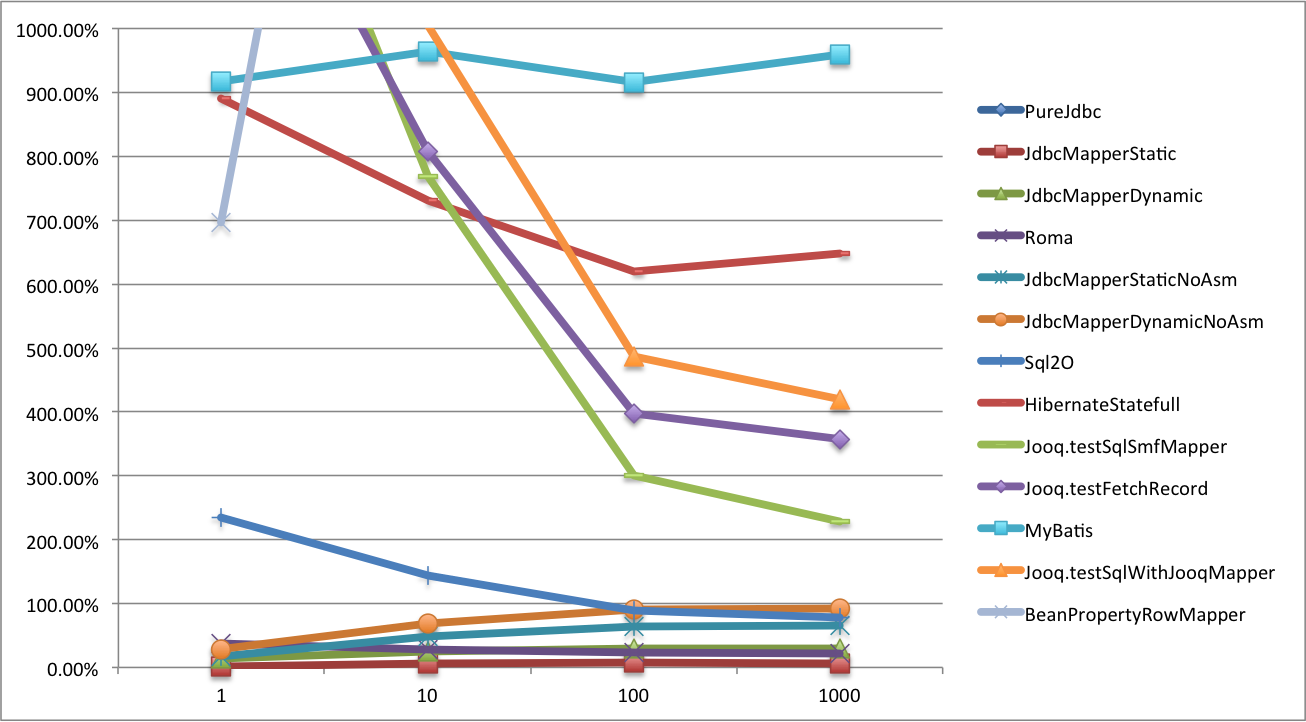
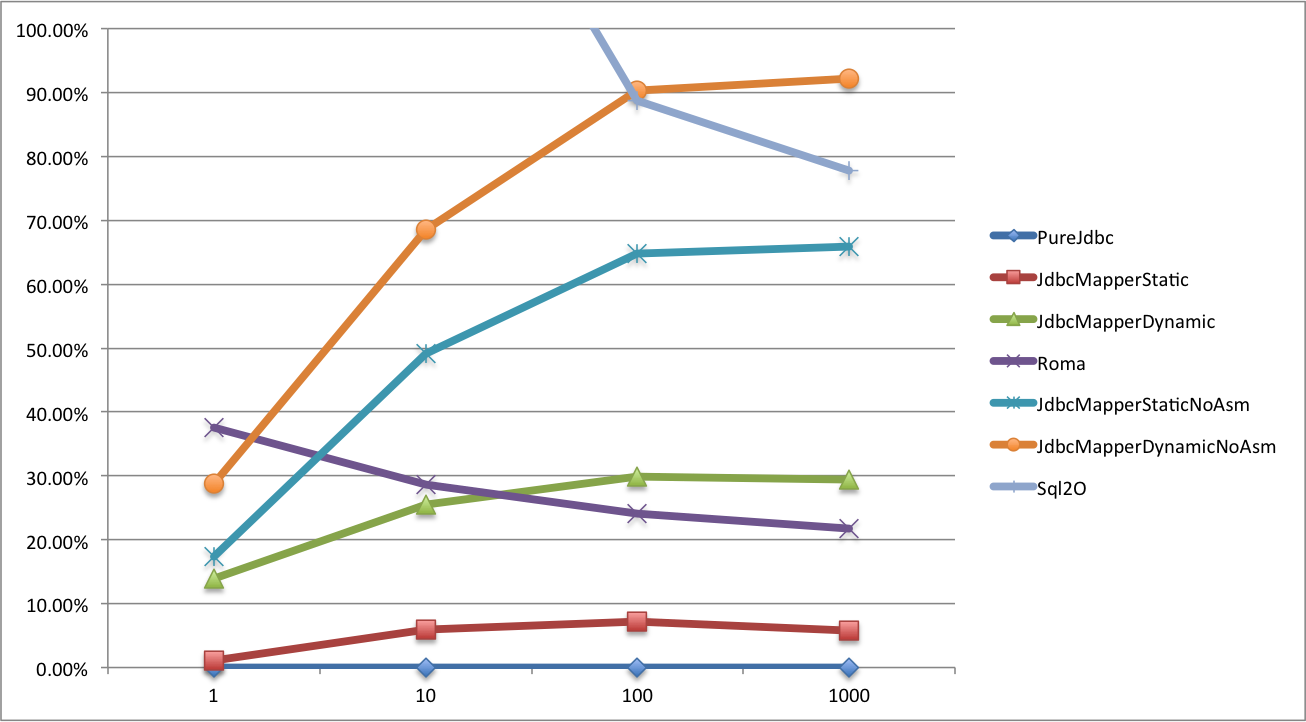
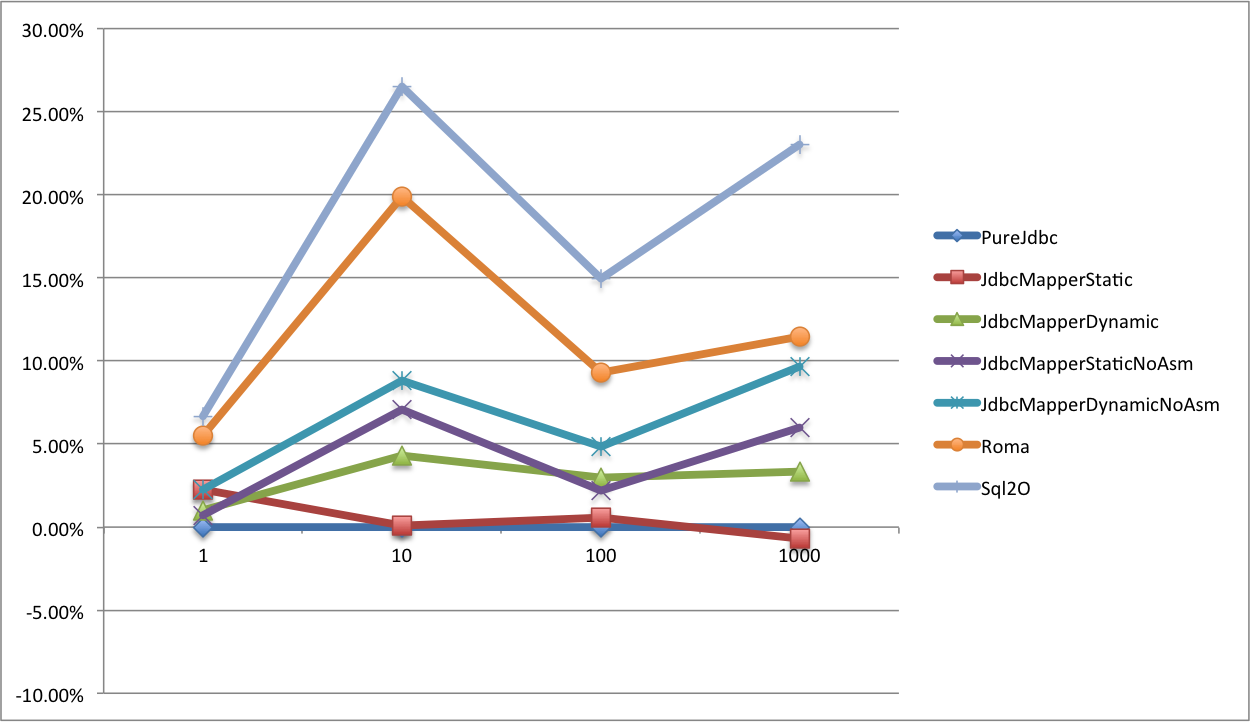
Average time ns/op to execute, fetch and map to object the result of a query with 1, 10, 100 and 1000 rows. The lower the better.
| Type/NbRows | 1 | 10 | 100 | 1000 |
|---|---|---|---|---|
| PureJdbc | 1,932.90 | 4,986.56 | 35,174.76 | 338,329.42 |
| JdbcMapperStatic | 1,954.16 | 5,279.25 | 37,706.48 | 358,078.39 |
| JdbcMapperStaticNoAsm | 2,267.64 | 7,437.84 | 57,942.24 | 561,286.74 |
| JdbcMapperDynamic | 2,200.64 | 6,257.11 | 45,709.15 | 438,085.40 |
| Roma | 2,657.83 | 6,414.74 | 43,654.80 | 411,799.35 |
| JdbcMapperDynamicNoAsm | 2,488.84 | 8,403.93 | 66,964.97 | 650,236.33 |
| Sql2O | 6,465.33 | 12,188.29 | 66,407.25 | 601,473.37 |
| HibernateStatefull | 19,145.09 | 41,438.27 | 253,079.29 | 2,529,606.26 |
| Jooq.testSqlSmfMapper | 32,453.58 | 43,294.91 | 141,045.88 | 1,109,438.57 |
| Jooq.testFetchRecord | 29,230.55 | 45,241.89 | 174,774.53 | 1,547,739.98 |
| MyBatis | 19,646.33 | 53,041.10 | 357,459.33 | 3,584,767.10 |
| Jooq.testSqlWithJooqMapper | 39,710.39 | 55,112.47 | 206,354.76 | 1,758,898.63 |
| BeanPropertyRowMapper | 15,400.30 | 124,064.49 | 1,219,259.23 | 12,240,426.71 |
% Difference from PureJdbc Average Time, the lower the better
% Difference from PureJdbc Average Time Top 5, the lower the better
Average time ns/op to execute, fetch and map to object the result of a query with 1, 10, 100 and 1000 rows. The lower the better.
| Type/NbRows | 1 | 10 | 100 | 1000 |
|---|---|---|---|---|
| PureJdbc | 245,656.97 | 320,380.17 | 729,210.15 | 2,895,357.10 |
| JdbcMapperStatic | 251,270.09 | 320,653.79 | 733,313.02 | 2,875,003.36 |
| JdbcMapperDynamic | 248,157.25 | 334,258.93 | 750,968.87 | 2,992,474.71 |
| JdbcMapperStaticNoAsm | 247,415.98 | 343,042.86 | 745,021.39 | 3,068,639.02 |
| JdbcMapperDynamicNoAsm | 251,177.79 | 348,578.86 | 764,346.22 | 3,175,026.15 |
| Roma | 259,116.64 | 384,132.92 | 796,816.93 | 3,227,048.33 |
| Sql2O | 262,054.32 | 405,365.22 | 838,182.64 | 3,562,668.86 |
| HibernateStatefull | 336,939.80 | 426,423.35 | 1,115,869.80 | 5,682,184.56 |
| Jooq.testSqlSmfMapper | 348,344.11 | 436,034.03 | 896,927.74 | 4,004,866.97 |
| Jooq.testFetchRecord | 347,525.13 | 450,962.73 | 963,248.30 | 4,493,950.56 |
| Jooq.testSqlWithJooqMapper | 353,089.58 | 451,104.95 | 919,301.63 | 4,062,534.46 |
| BeanPropertyRowMapper | 319,099.37 | 513,320.26 | 2,039,824.24 | 14,979,374.50 |
| MyBatis | 436,415.82 | 533,972.72 | 1,244,039.59 | 7,506,197.17 |
% Difference from PureJdbc Average Time, the lower the better
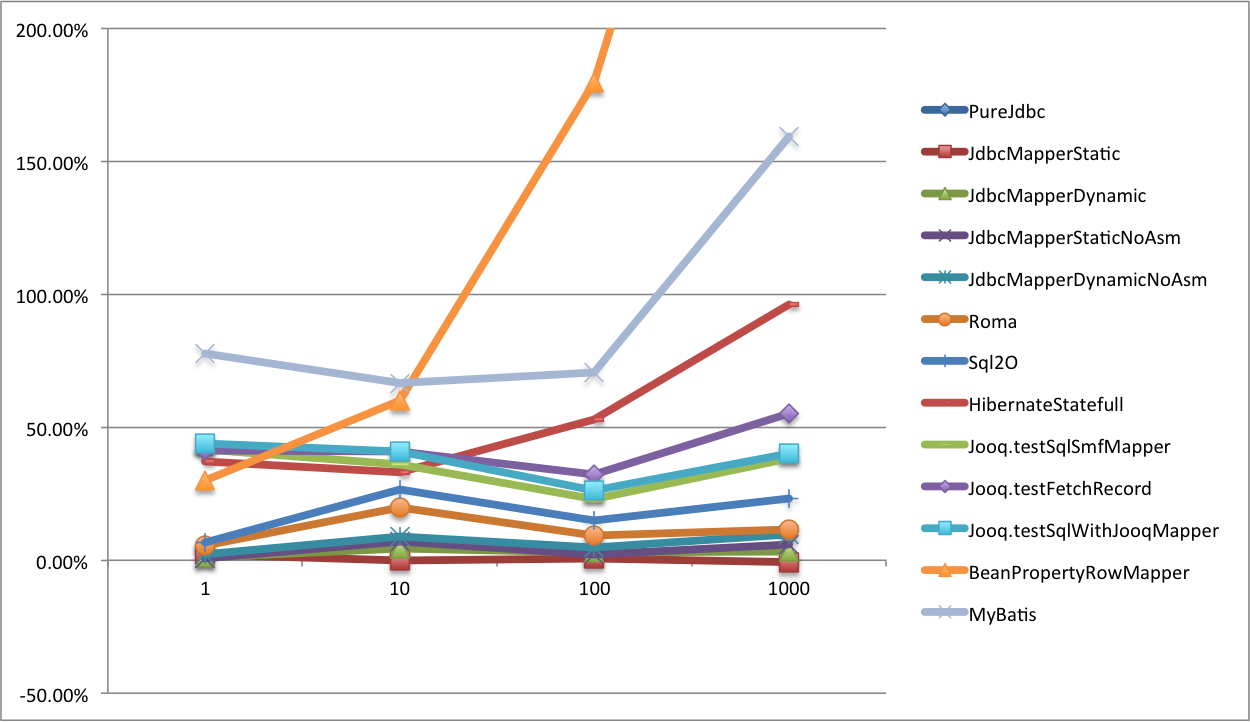
% Difference from PureJdbc Average Time Top5, the lower the better
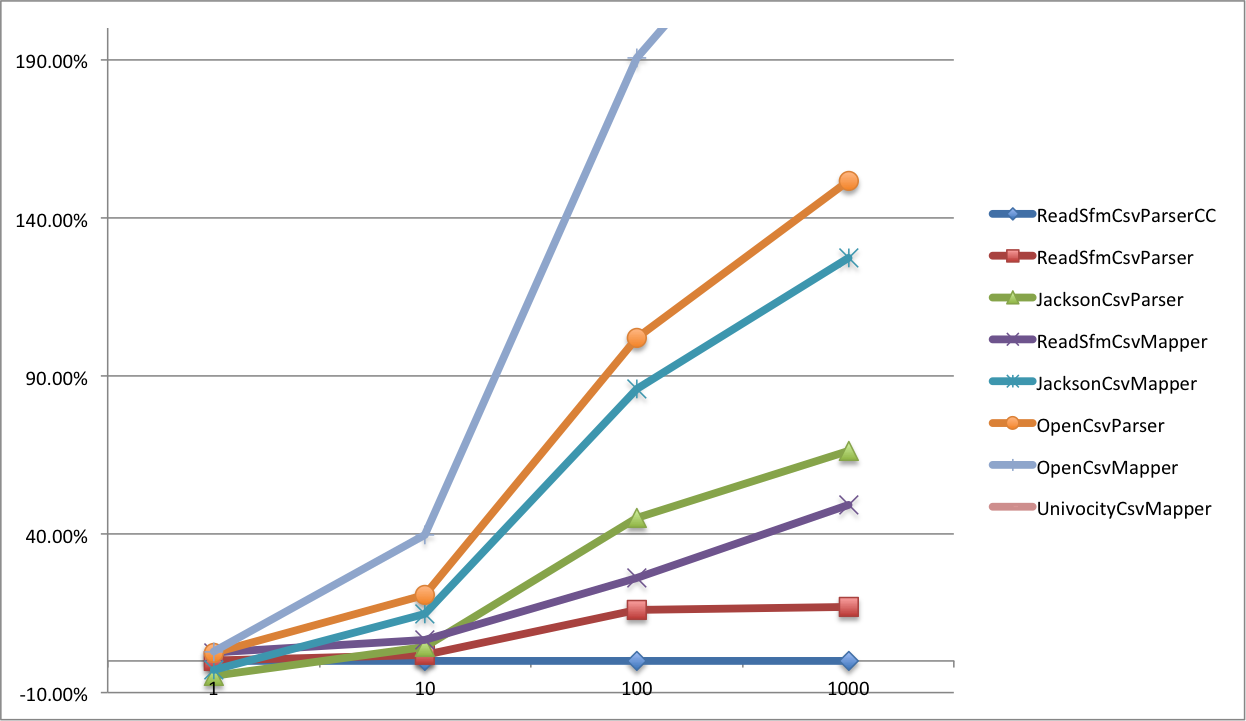
Jmh benchmark. Average time in us to parse to string[] or map to object a csv file with 10, 1000 and 100000 rows. The lower the better.
| Type/NbRows | 1 | 10 | 100 | 1000 |
|---|---|---|---|---|
| ReadSfmCsvParserCC | 20,584.62 | 23,730.37 | 52,360.85 | 366,639.38 |
| ReadSfmCsvParser | 20,614.28 | 24,150.91 | 60,806.27 | 428,892.15 |
| JacksonCsvParser | 19,617.47 | 24,818.92 | 76,091.80 | 609,871.26 |
| ReadSfmCsvMapper | 21,134.15 | 25,295.15 | 66,029.66 | 547,569.08 |
| JacksonCsvMapper | 19,972.12 | 27,252.62 | 97,386.60 | 833,531.50 |
| OpenCsvParser | 21,081.64 | 28,698.62 | 105,820.02 | 922,870.29 |
| OpenCsvMapper | 21,203.23 | 33,196.16 | 152,187.01 | 1,348,454.90 |
| UnivocityCsvMapper | 5,333,892.72 | 5,398,188.54 | 5,492,224.03 | 6,411,397.53 |
% Difference from ReadSfmCsvParserCC Average Time, the lower the better
