DOM Debugging in Visual Studio
For the upcoming release of ATF 3.6, in late July, the DomNode and DomNodeAdapter will present additional diagnostic information about themselves in the Visual Studio debugger.

Each attribute name is displayed next to the attribute's value. If there is no "local" value, then the default value is displayed. Previously, there was no way to directly see the default value in the m_data array.
Each child DomNode has its name displayed.
If you need to identify what objects will receive one of the six DomNode events (attribute changing/changed, child inserting/inserted, child removing/removed), you can see those now, in the order that they will receive events. Previously, stepping through the event raising code was the only way to find these listeners, and it was very tedious.
DomNodes now display a hash code in addition to their DomNodeType. This will greatly help identify particular DomNodes. The hash codes should be the equivalent of unique IDs for the current debugging session; they're supposed to be unique to the whole AppDomain.
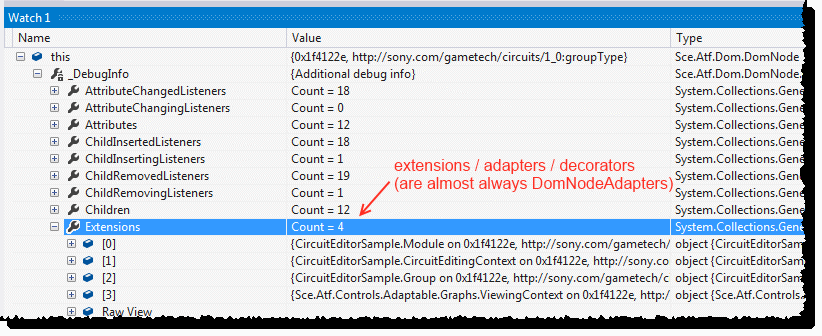
For the sake of completeness, the DomNode extensions (which are almost always DomNodeAdapters) can be listed, too. Previously, these were only visible in the m_data array.
There is no change to how the DomNodes store their data or raise events. These changes only add additional information in the debugger watch window.
No new tool needs to be installed. The debugger (in VS2008, VS2010, and VS2012) will find the C# attributes (from System.Diagnostics) on the DomNode that indicate that the displayed names and values should be customized. This MSDN article describes these attributes.
There are also planned improvements for the DomRecorder.
If there is additional debugging information that is desired, please let us know.

- Home
- Getting Started
- Features & Benefits
- Requirements & Dependencies
- Gallery
- Technology & Samples
- Adoption
- News
- Release Notes
- ATF Community
- Searching Documentation
- Using Documentation
- Videos
- Tutorials
- How To
- Programmer's Guide
- Reference
- Code Samples
- Documentation Files
© 2014-2015, Sony Computer Entertainment America LLC