Tutorial I: Reading ROOT Input (1)
For testing purposes, there is a script to fill a TTree in a ROOT file with Gaussian random numbers.
generateCorrelatedGaussians.py
generateCorrelatedGaussians.py -t gaussians1 gaussians2 gaussians3 -o gaussians3.root
generateCorrelatedGaussians.py --n-events 1000 -o gaussians1000.root
Execute it to get an example file for plotting. This tutorial is based on the output of these commands (gaussians.root, gaussians3.root and gaussians100.root).
There are several ways to inspect the contend of a ROOT file. This works for arbitrary ROOT files.
-
tBrowser.sh gaussians.root
-
get_root_file_content.py gaussians.root [--log-level debug]
This script is in many cases the fastest option to see what objects a ROOT file contains. By using the debug logging option, the
TObject.Printfunctions are called. -
get_entries.py gaussians.root
-
print_trees.py gaussians.root
The size of the output corresponds to the size of the trees. Therefore this script is rather recommended for small trees.
-
get_binning.py gaussians.root
This does not give an output for the file
gaussians.root, because it does not contain any histogram.
Similar tools can be easily added. Get inspired by looking at the code of these scripts.
The examples here are based on the testing files generated above.
The default input module of HarryPlotter (InputRoot) is able to read in data from ROOT trees as well as every other drawable ROOT object (e.g. histograms, graphs and functions). Two arguments are important to specify the input: -i and -f. The first takes the input ROOT file(s) and the second the folder(s)/path(s) inside the ROOT file pointing either to a TDirectory containing drawable objects or to a TTree object. This part of the tutorial focusses the options related to a single input. Explanations about multiple inputs are given in part 2.
In this section, all plots are done with the PlotRoot backend with the additional option --plot-modules PlotRoot.
-
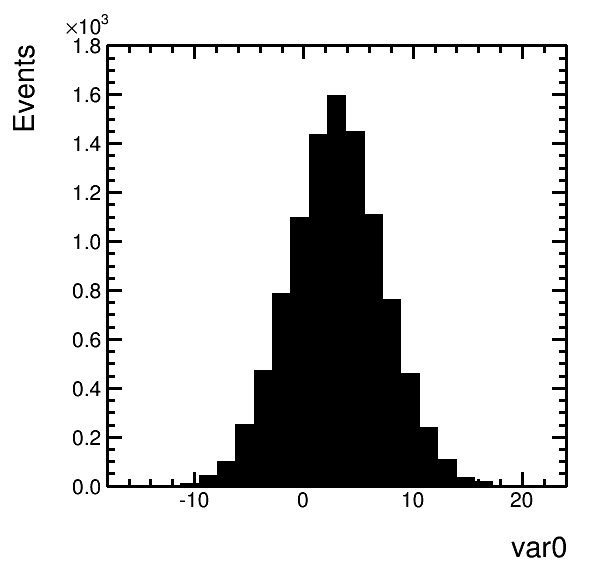
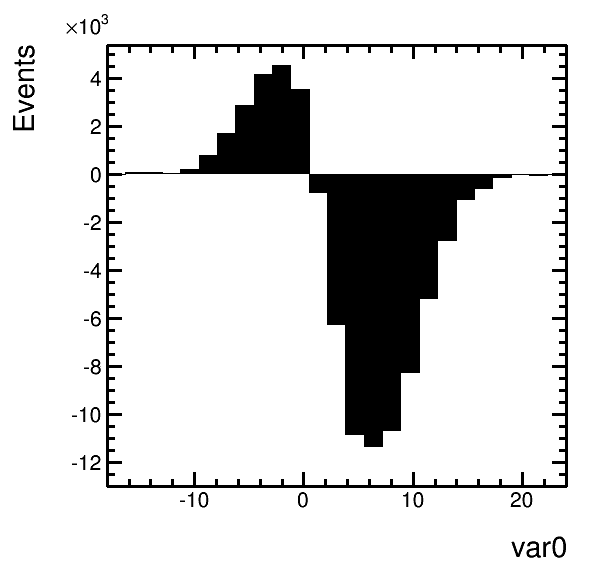
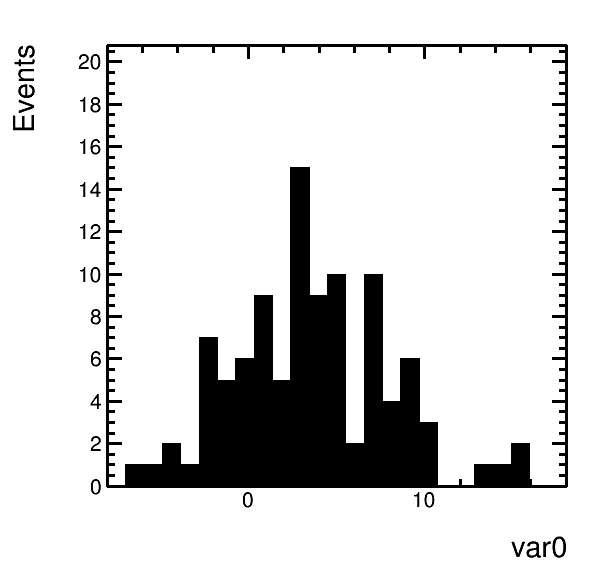
harry.py -i gaussians3.root -f gaussians1 -x var0
-
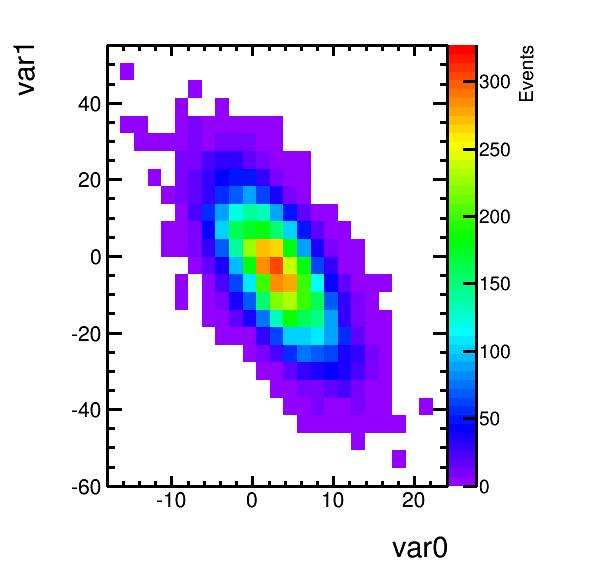
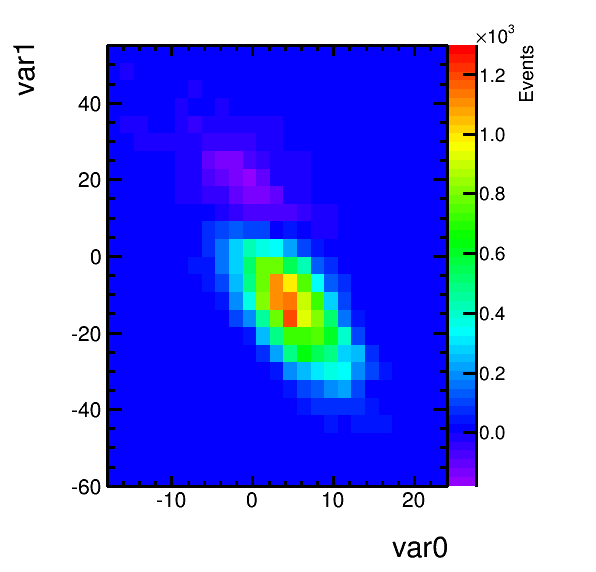
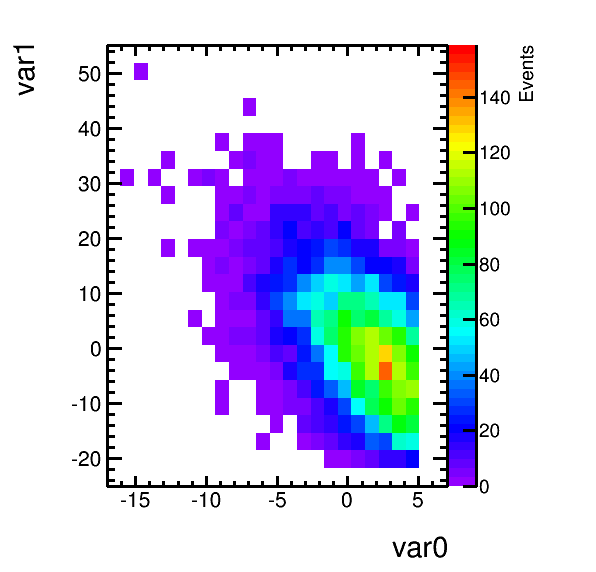
harry.py -i gaussians3.root -f gaussians1 -x var0 -y var1
-
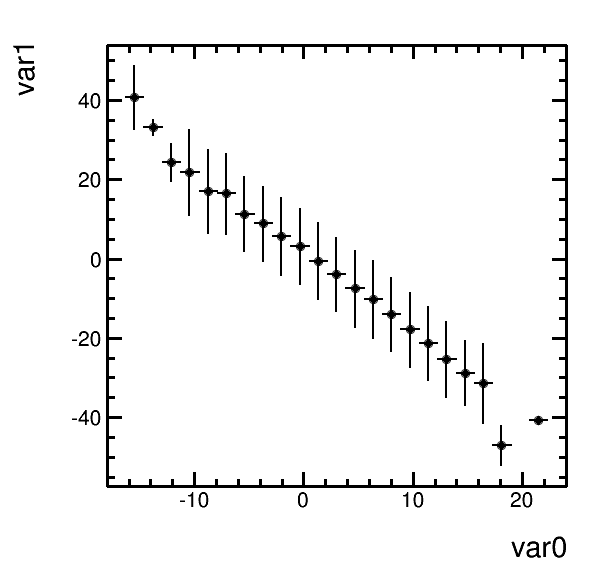
harry.py -i gaussians3.root -f gaussians1 -x var0 -w var1
-
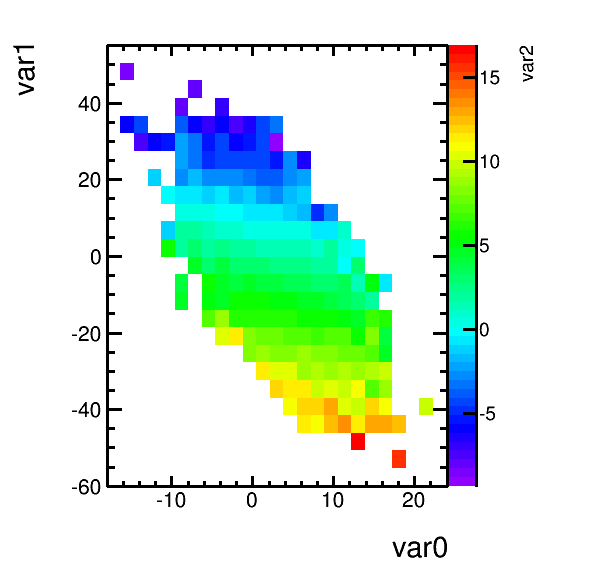
harry.py -i gaussians3.root -f gaussians1 -x var0 -y var1 -w var2
The functionallity of the InputRoot module of HarryPlotter is completely based on the very versatile functions TChain.Add and TTree.Draw in ROOT. First the input tree is filled with calls of
TChain.Add(<file>/<folder>)
where <file>/<folder> are the arguments of -i/-f. Then the histograms are filled using the functionallity of
TTree.Draw([[<z>:]<y>:]<x> >>name <binning>, <weight>, <tree draw option>)
where the arguments -x/-y/-z, --x-bins/--y-bins/--z-bins, -w and --tree-draw-options are used. This means, that these arguments support all options documented in the link above. The calls of these two functions are printed with debug options --log-level debug. For example,
harry.py -i gaussians3.root -f gaussians1 -x var0 --log-level debuggives the output
Reading from ntuple gaussians3.root/gaussians1 ...
ROOT.TTree.Draw("var0>>histogram_1b95afa2adc1683092da6ef154c4bbdf(25,,)", "1.0", " GOFF")
Some examples:
-
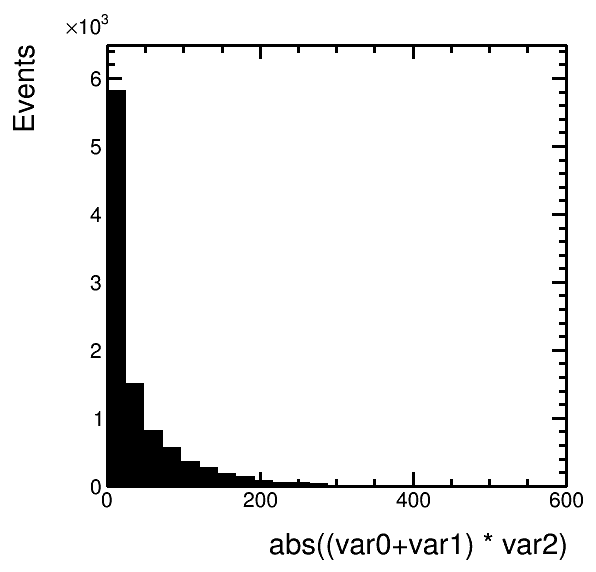
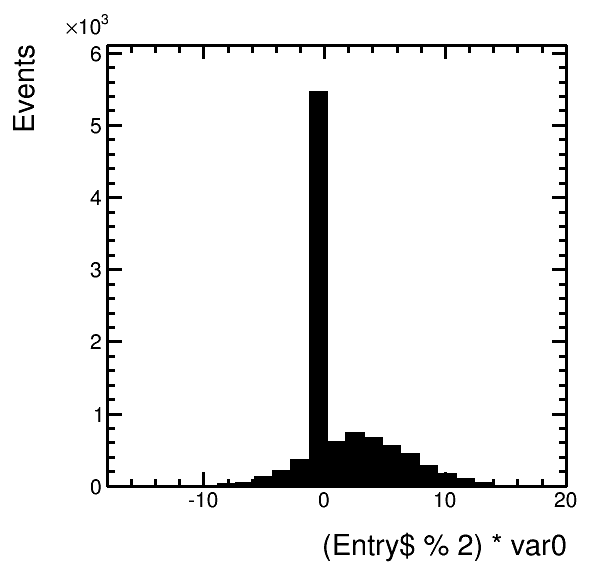
The syntax of formulas is described in the documenation of the TFormula class.
 harry.py -i gaussians3.root -f gaussians1 -x "abs((var0+var1) * var2)"
 harry.py -i gaussians3.root -f gaussians1 -x "(Entry$ % 2) * var0"
-
 harry.py -i gaussians3.root -f gaussians1 -x var0 -y var1 -w "(var0 < 5) * (var1 > -20)"
 harry.py -i gaussians3.root -f gaussians1 -x var0 -w "Entry$ < 100"
-
 harry.py -i gaussians3.root -f gaussians1 -x var0 -y var1 --tree-draw-options profs
 harry.py -i gaussians3.root -f gaussians1 -x var0 -y var1 -z var2 --tree-draw-options profs
-
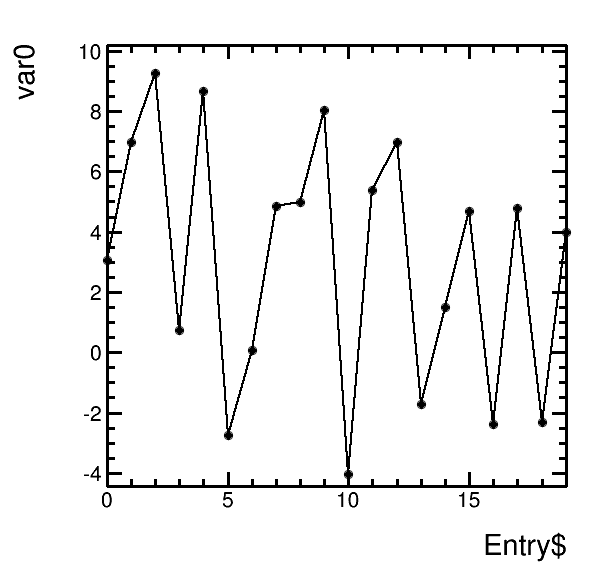
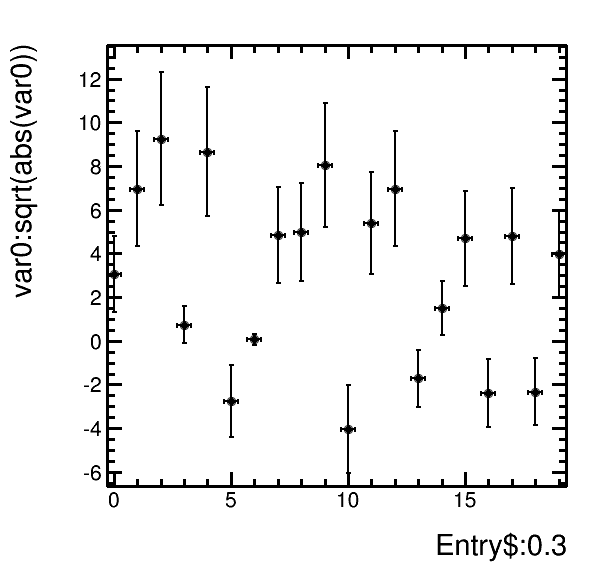
 harry.py -h | grep " --tree-draw-options" -A 21
 harry.py -i gaussians3.root -f gaussians1 -x Entry$ -y var0 --tree-draw-options TGraph -w "Entry$ < 20" --plot-modules PlotRoot -m PL
 harry.py -i gaussians3.root -f gaussians1 -x Entry$:0.3 -y "var0:sqrt(abs(var0))" --tree-draw-options TGraphErrors -w "Entry$ < 20" --plot-modules PlotRoot -m P