Matplotlib colormaps from the yt project !
The following colormaps, as well as their respective reversed (*_r) versions are available
with pip
python -m pip install cmytor with conda
conda install -c conda-forge cmytcmyt integrates with matplotlib in a similar fashion to cmocean or cmasher
import numpy as np
import matplotlib.pyplot as plt
import cmyt  # that's it !

# generate example data
prng = np.random.RandomState(0x4D3D3D3)
noise = prng.random_sample((100, 100))
x, y = np.mgrid[-50:50, -50:50]
z = 5 * np.exp(-(x**2 + y**2) / 1000)

# setup the figure
fig, ax = plt.subplots()
ax.set(aspect="equal")

# now we can refer to cmyt colormaps as strings
im = ax.pcolormesh(x, y, z + noise, cmap="cmyt.arbre", shading="flat")
fig.colorbar(im, ax=ax)
# alternatively, cmyt maps can also be imported as objects
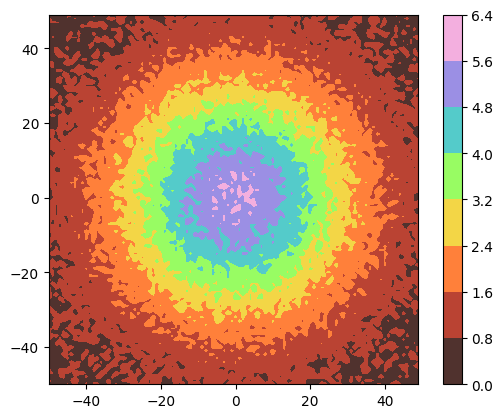
from cmyt import pastel
fig, ax = plt.subplots()
ax.set(aspect="equal")
im = ax.contourf(x, y, z + noise, cmap=pastel)
fig.colorbar(im, ax=ax)A gallery of comparable examples using all colormaps from cmyt is available in the test directory.


