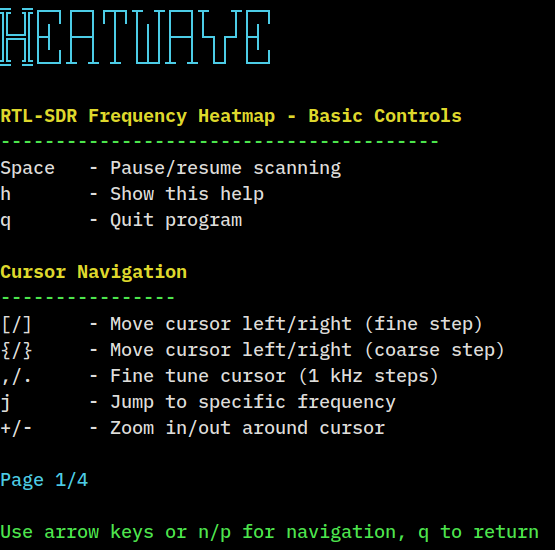
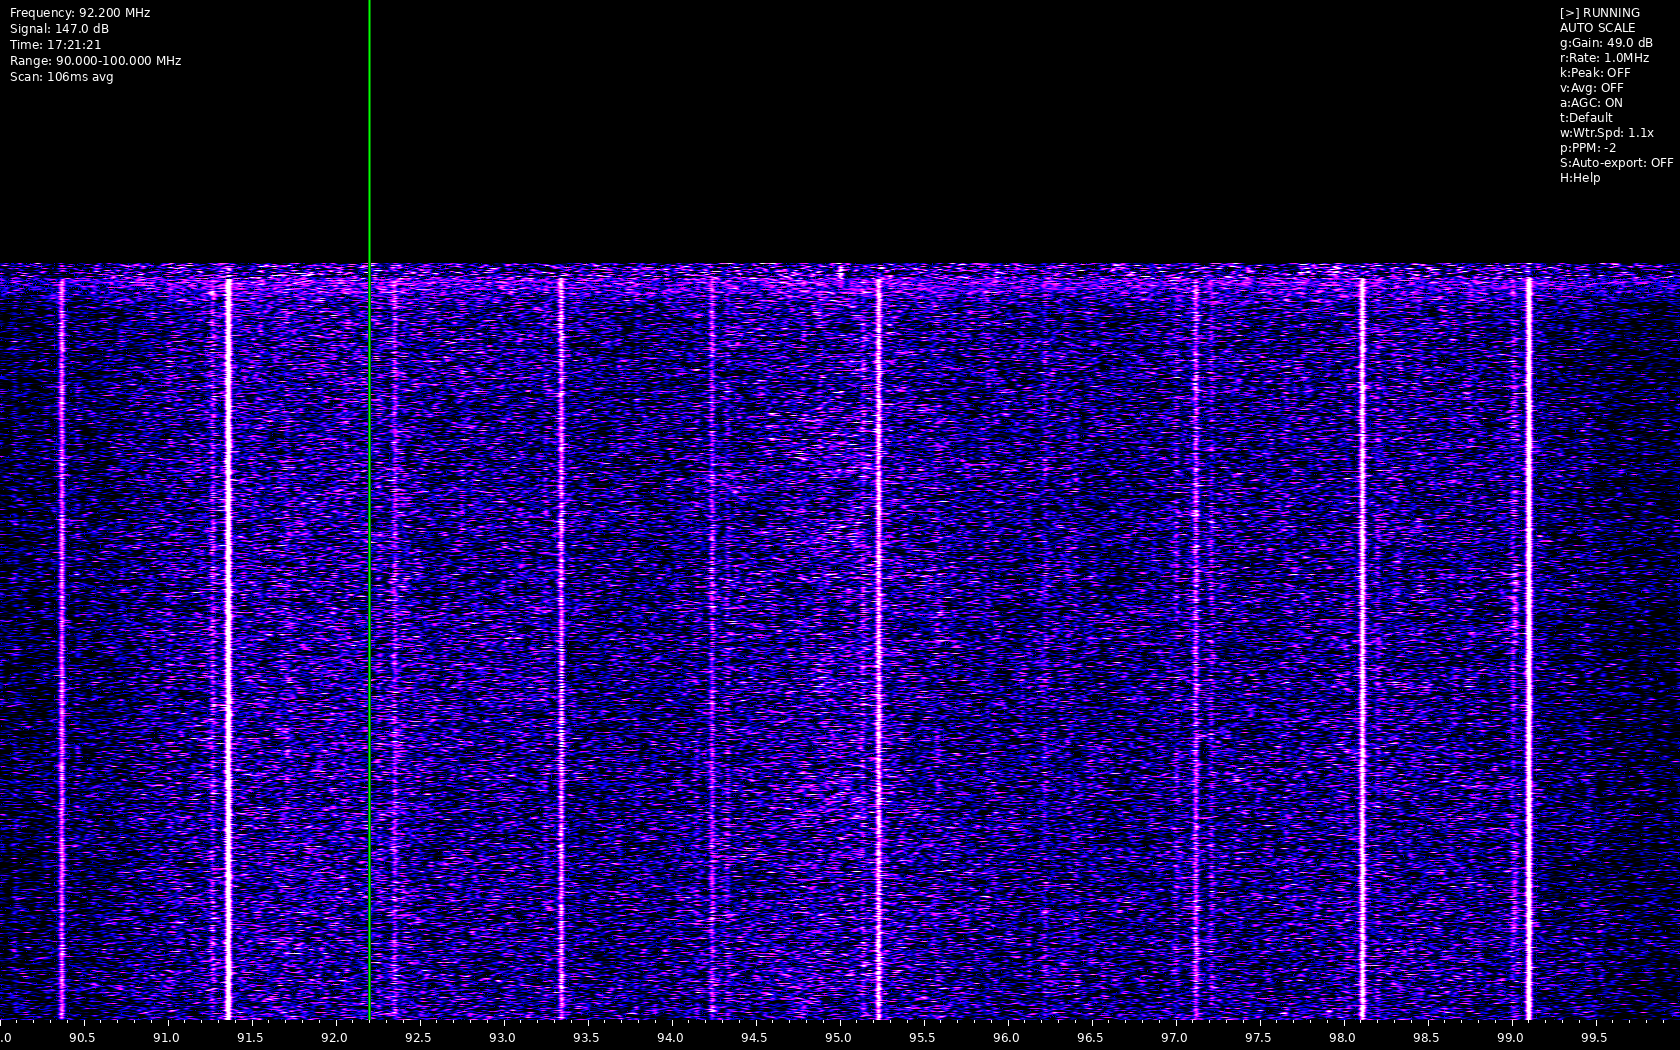
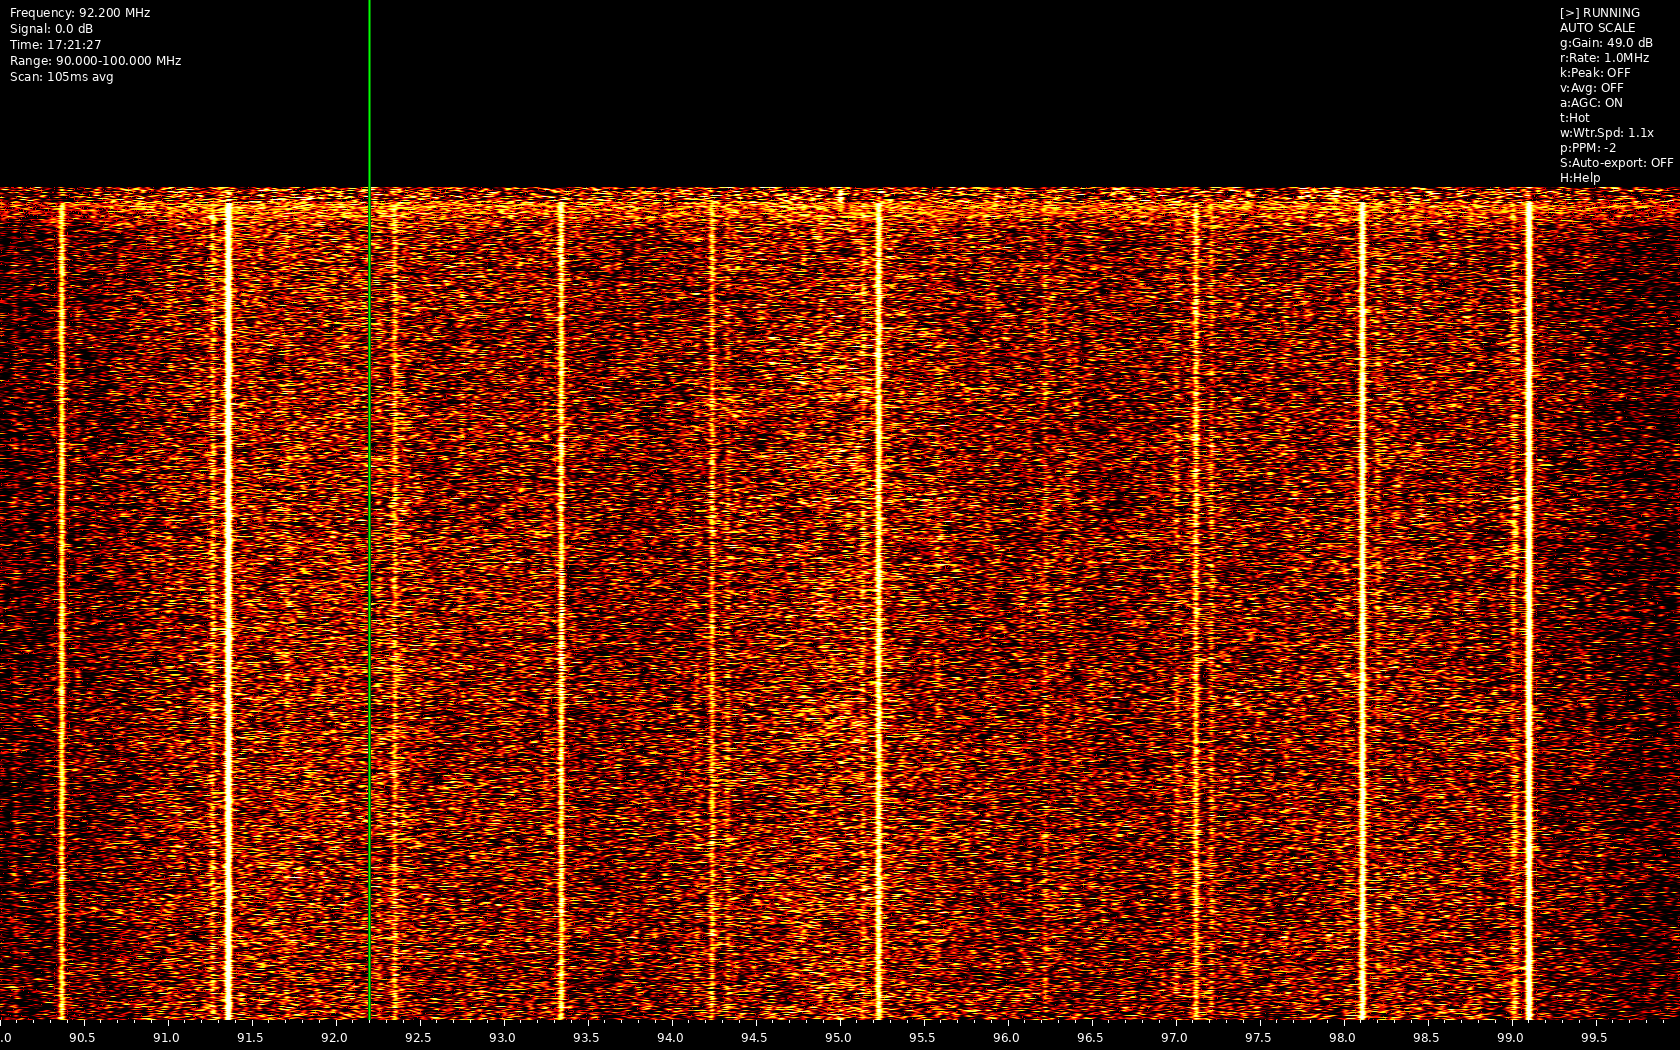
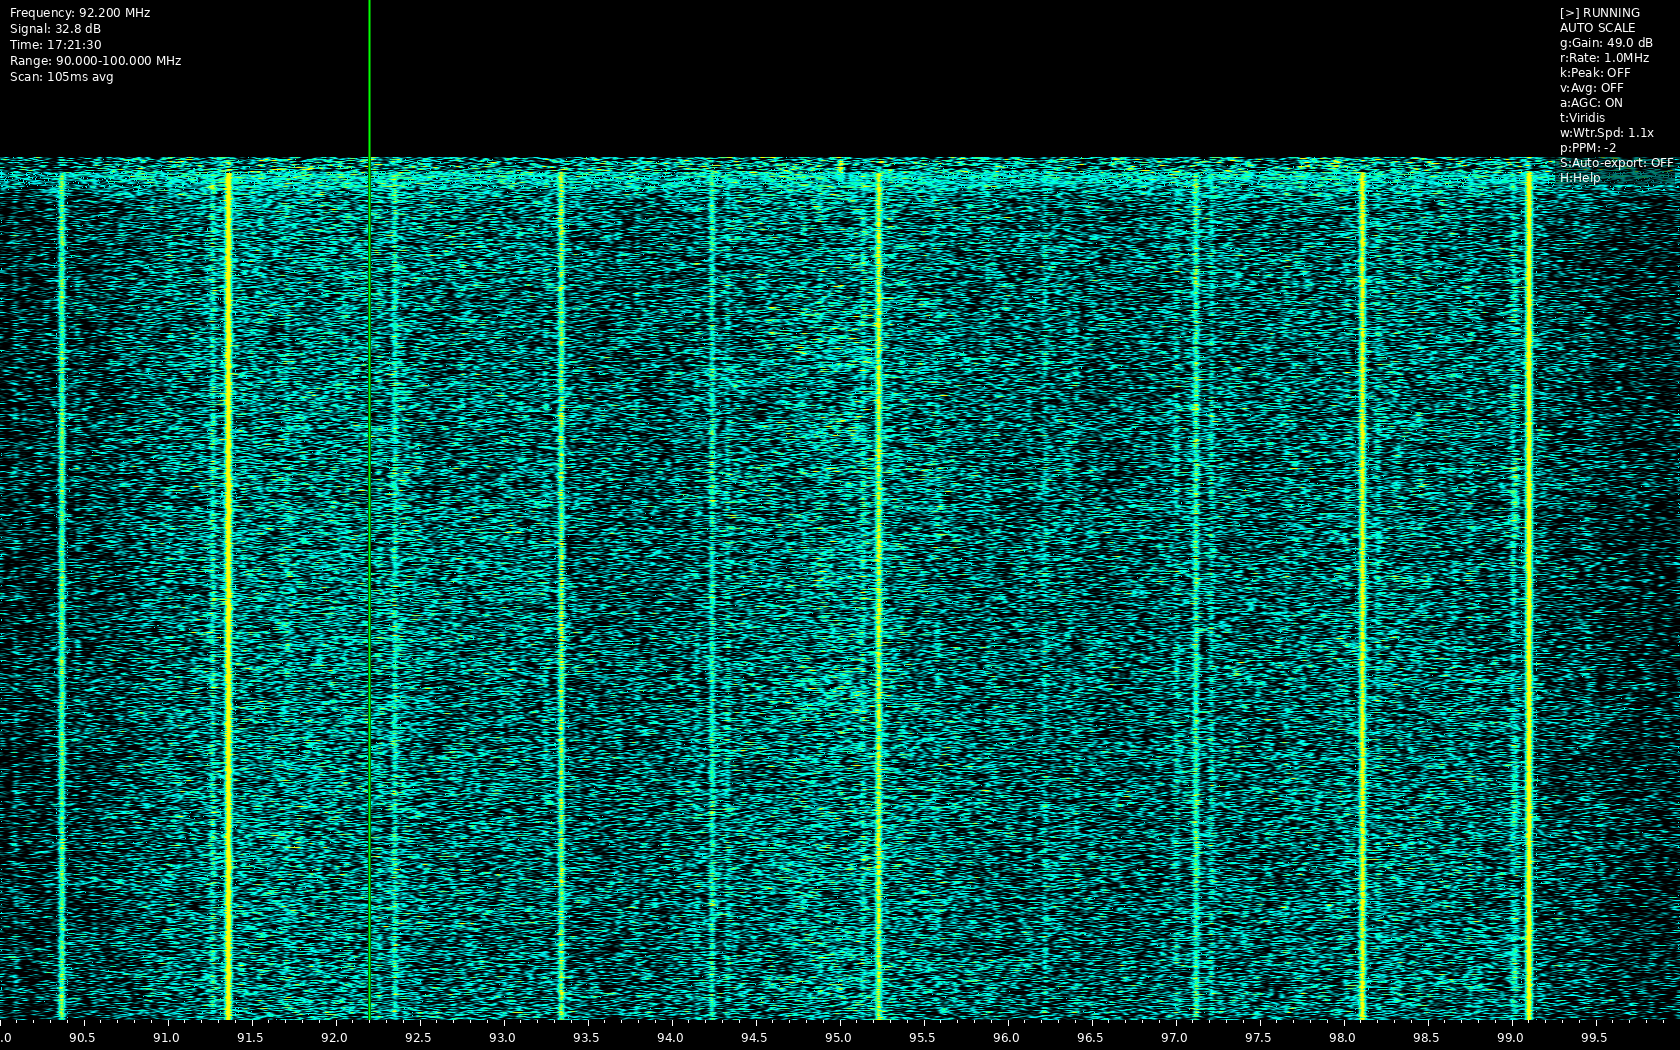
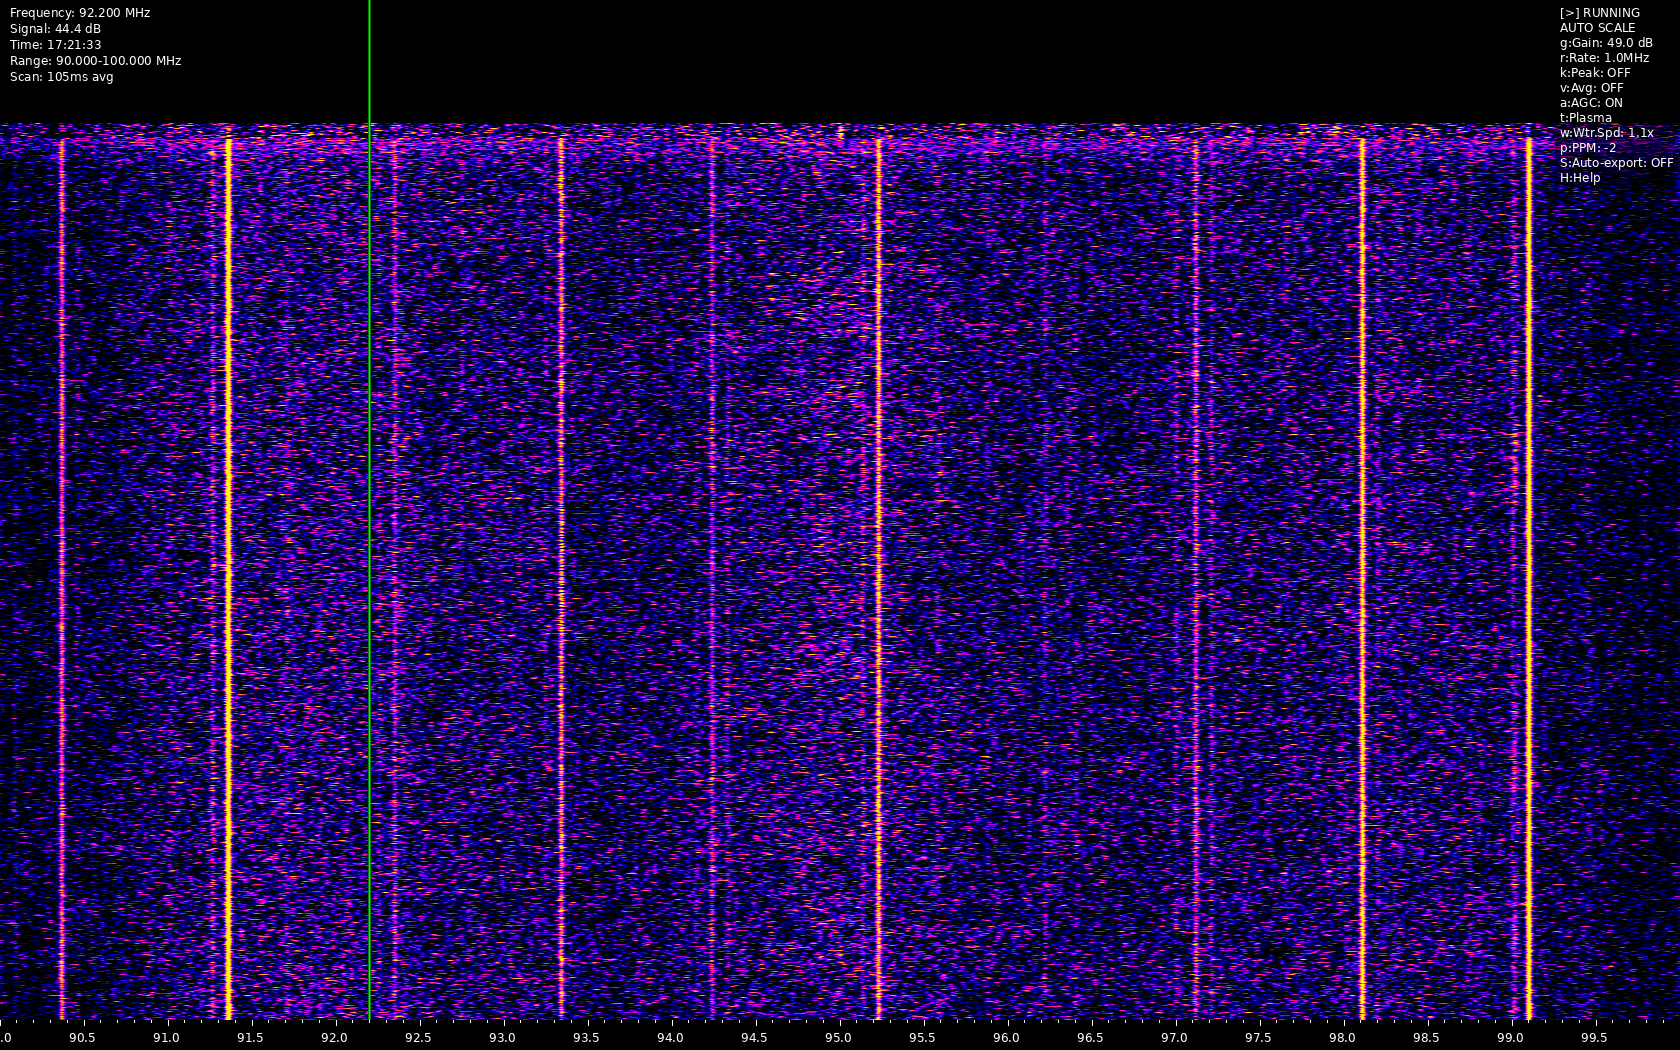
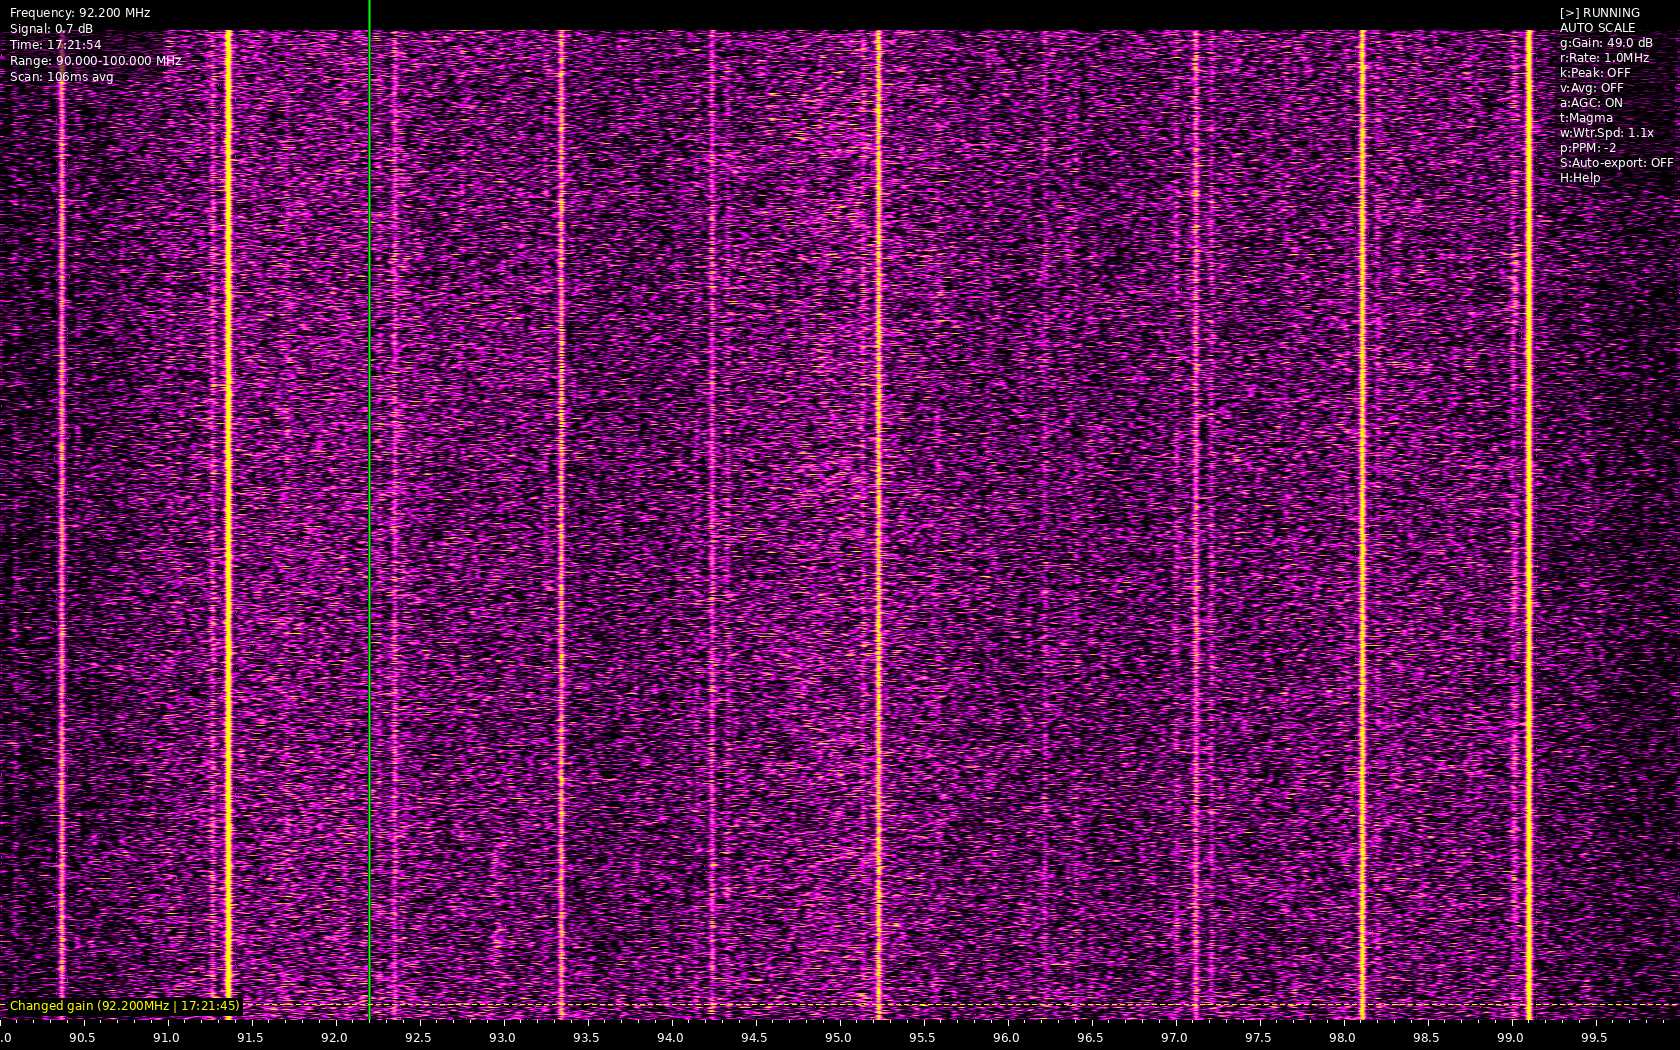
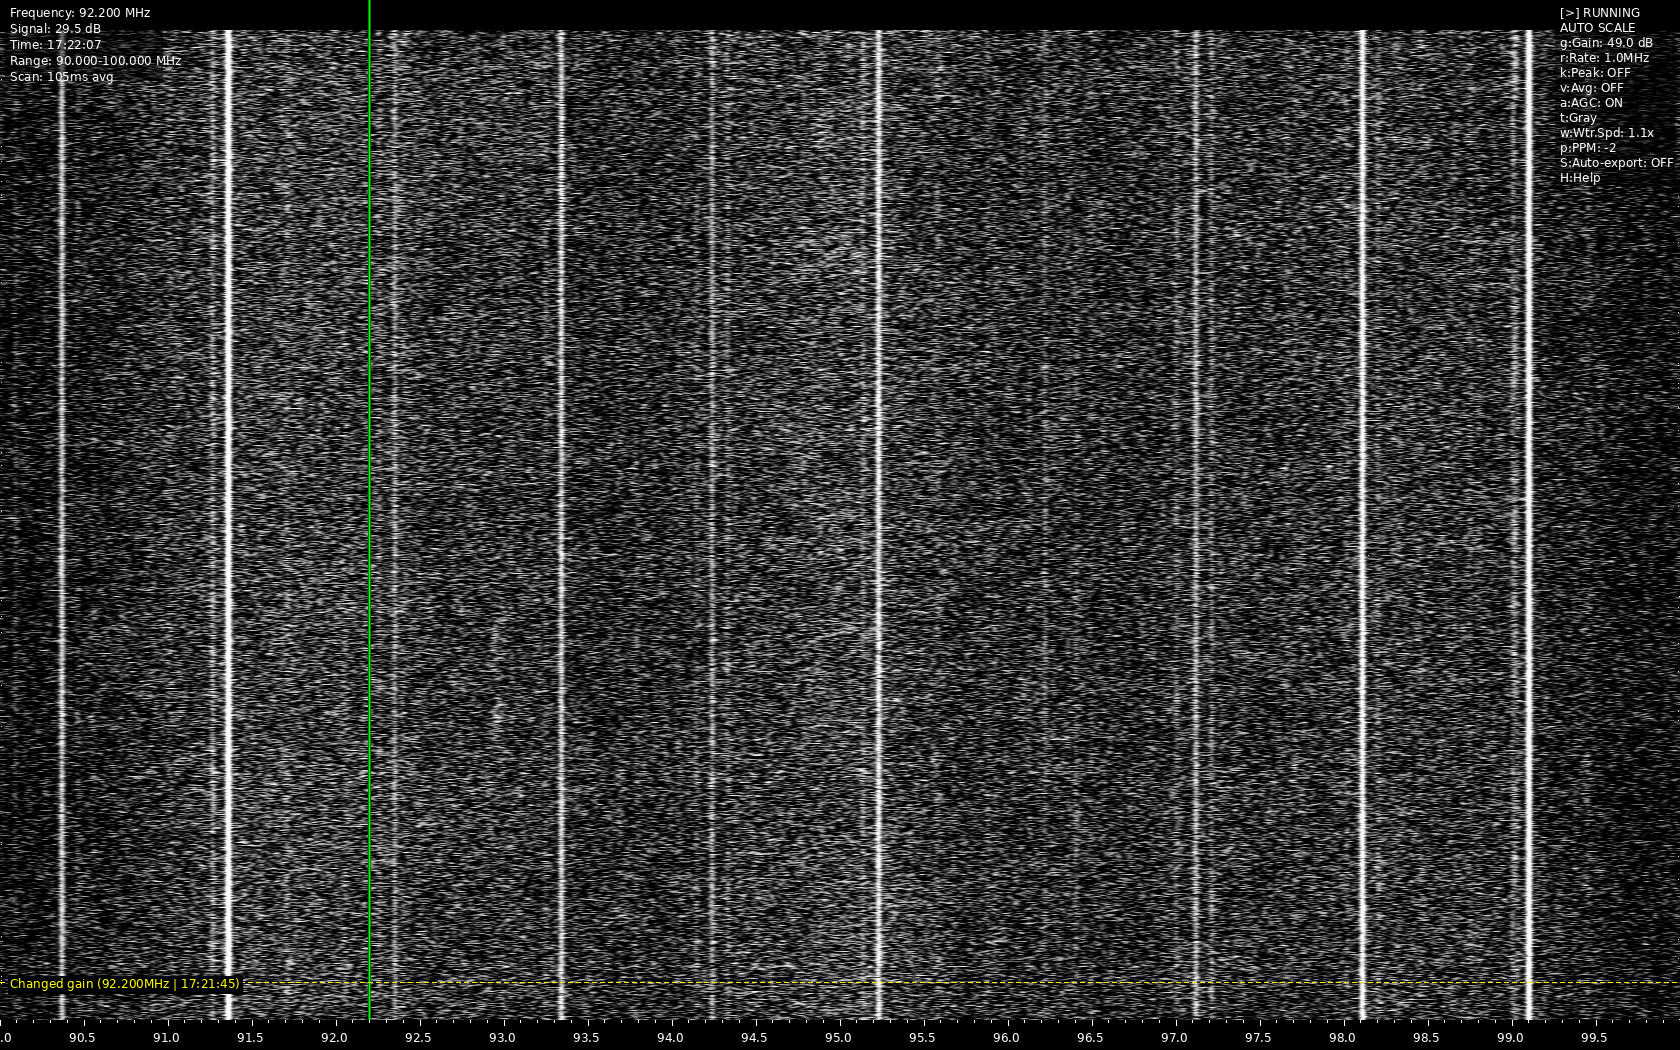
Heatwave is a real-time RF spectrum analyzer that creates a waterfall display using RTL-SDR and other SoapySDR-compatible devices. It provides a visual representation of RF activity across frequency ranges with various analysis tools and features.
It uses the Linux framebuffer for graphics drawing!
- Real-time waterfall display of RF spectrum
- Multiple color schemes for visualization
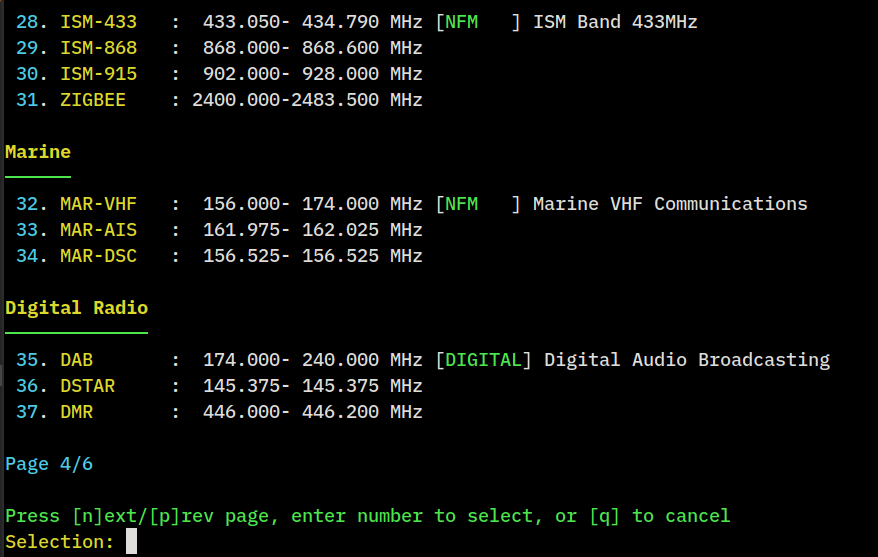
- Frequency band presets for common radio services
- Automatic Gain Control (AGC)
- Signal peak detection and analysis
- Time-based annotations
- Screenshot and data export capabilities
- Configurable display parameters
- Session persistence with settings save/load
- Framebuffer visualization
- Adjustable waterfall speed
- Peak hold visualization
- Signal averaging
- Auto-scaling
- Customizable color schemes
- Frequency markers and annotations
- Signal strength measurements
- Frequency band information
- Time-stamped annotations
- Spectrum data export
- Signal peak detection
- Python 3.x
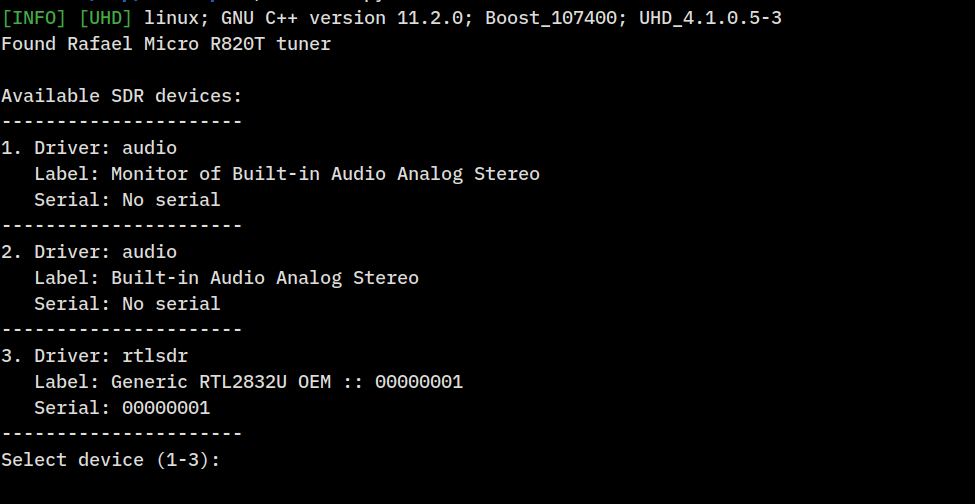
- RTL-SDR or other SoapySDR-compatible device
- Linux system with framebuffer access
- Python packages:
- numpy
- SoapySDR
- scipy
- Pillow
- termios (usually included with Python)
- Install required system packages:
sudo apt-get install python3-pip python3-numpy python3-soapysdr python3-scipy python3-pillow
- Clone the repository:
git clone https://github.com/yourusername/heatwave.git
cd heatwave
- Make the script executable:
chmod +x heatwave.py
The program uses framebuffer for displaying graphics. Make sure your system is configured properly to allow you use the framebuffer. A proper setup, should i allow you to use the framebuffer, with out sudo privileges.
I wont describe how to enable the use of the framebuffer, as the process differs for each linux distribution/system.
Some devices use 16bit colors for the framebuffer. The program supports both 32bit and 16bit modes, with the use of the --color-mode parameter. If you get an error while initializing the framebuffer change the value of color mode. By default the program starts in 32bit color mode.
Run the script with:
/heatwave.py <start_freq> <end_freq> <--color-mode 16|32>
Pressing the e key, will export a set of files, into the 'exports' directory. It will export raw data, in a .npz file, an image screenshot of the heatmap and a .json file, containing the current options used in the program at the time of the screenshot.
Enabling this feature, will export data/screenshot every time the buffer fills. The process will save an image screenshot, with a filename containing, frequency and date/time. This way, you can have the program running in the background and after, check the images for signals and additional data.
You can add a note at any time, pressing the n key. The program will ask you to type a test, and it will also add the current frequency of the cursor line and a timestamp. You can use notations to add info on changes you make and have as a reference, with a screenshot of the heatmap.
You can set markers on the heatmap to jump between frequencies. You set a marker with the 6 to 0 keys, and use the saved marker with the 1 to 5 keys. The cursor provides info on the frequency and signal strengh.
Settings are automatically saved to ~/.config/heatwave/settings.json and include:
- Sample rate
- Color scheme
- Scroll speed
- Gain settings
- AGC parameters
- Display preferences
- Frequency markers
GPL-3.0-or-later
- SoapySDR project
- RTL-SDR community
- Fix bugs
Copyright (c) 2024 [XQTR]