The project aim to demonstrate how to integrate a simple Spring Boot application with built-in prometheus exporter and how to containerizer and create automactly the proccess using ansible to create a Kubernetes (k8s) Cluster in Google Cloud Platform GCP)' build and push the docker image to GCP registry; and, finally the service creating and expositing in k8s.
A complete pipeline using the Amazon Web Services was created to demonstrate the CI/CD process in Amazon Web Service Container Systems (ECS), using AWS ECS Fargate do host the application, one of the main advantages of using a Fargate cluster is that only processing time relative to tasks and execution, and only when they are active, will be charged, ie unlike Google Kubernestes Cluster, will not be charged for the resources of the processing nodes used in the cluster .
- Show Homer Simpson picture when accessing /homersimpson
- Show the time in the moment of request in Covilha City (Portugal) when accessing /covilha.
- Backend Java using JDK 8 to ensure compatibility with docker image openjdk:8-jdk-alpine, one of the smallest docker images n docker hub (103MB)
- Spring Boot as MVC framework to enjoy several built-in facilities, such as Spring Security, Spring Rest, Spring AOP, etc
- Maven as build automation tool, because the many possibilities of plugins to atomatize the several boring build taks.
- Google Cloud Platform as Kubernetes Clusters with 3 nodes n1-standard-1 (1 vCPU e 3.75GB.
- Ansible as configuration management mechanism.
- /homersimpson
- /covilha
- /prometheus (Prometheus exposed metrics)
The aplication has build and deployed on k8s using ansible playbooks avaible on https://github.com/xjulio/spring-boot-prometheus-k8s/tree/master/ansible. Variables adjustments must be done in https://github.com/xjulio/spring-boot-prometheus-k8s/blob/master/ansible/vars/main.yml to make the project works, also the GCP SDK must be configured following the Google documentation in: https://cloud.google.com/sdk/docs/quickstarts.
The cluster was created by ansible playbook:
---
- name: Build Docker APP Docker Image
  hosts: localhost
  gather_facts: no
  connection: local

  tasks:
    - name: Include ssh vars
      include_vars: ../vars/main.yml

    - name: create a cluster
      gcp_container_cluster:
          name: "{{ cluster_name }}"
          initial_node_count: 3
          project: "{{ gcp_project }}"
          zone: "{{ gcp_zone }}"
          auth_kind: serviceaccount
          service_account_file: "{{ gcp_cred_file }}"
          state: present
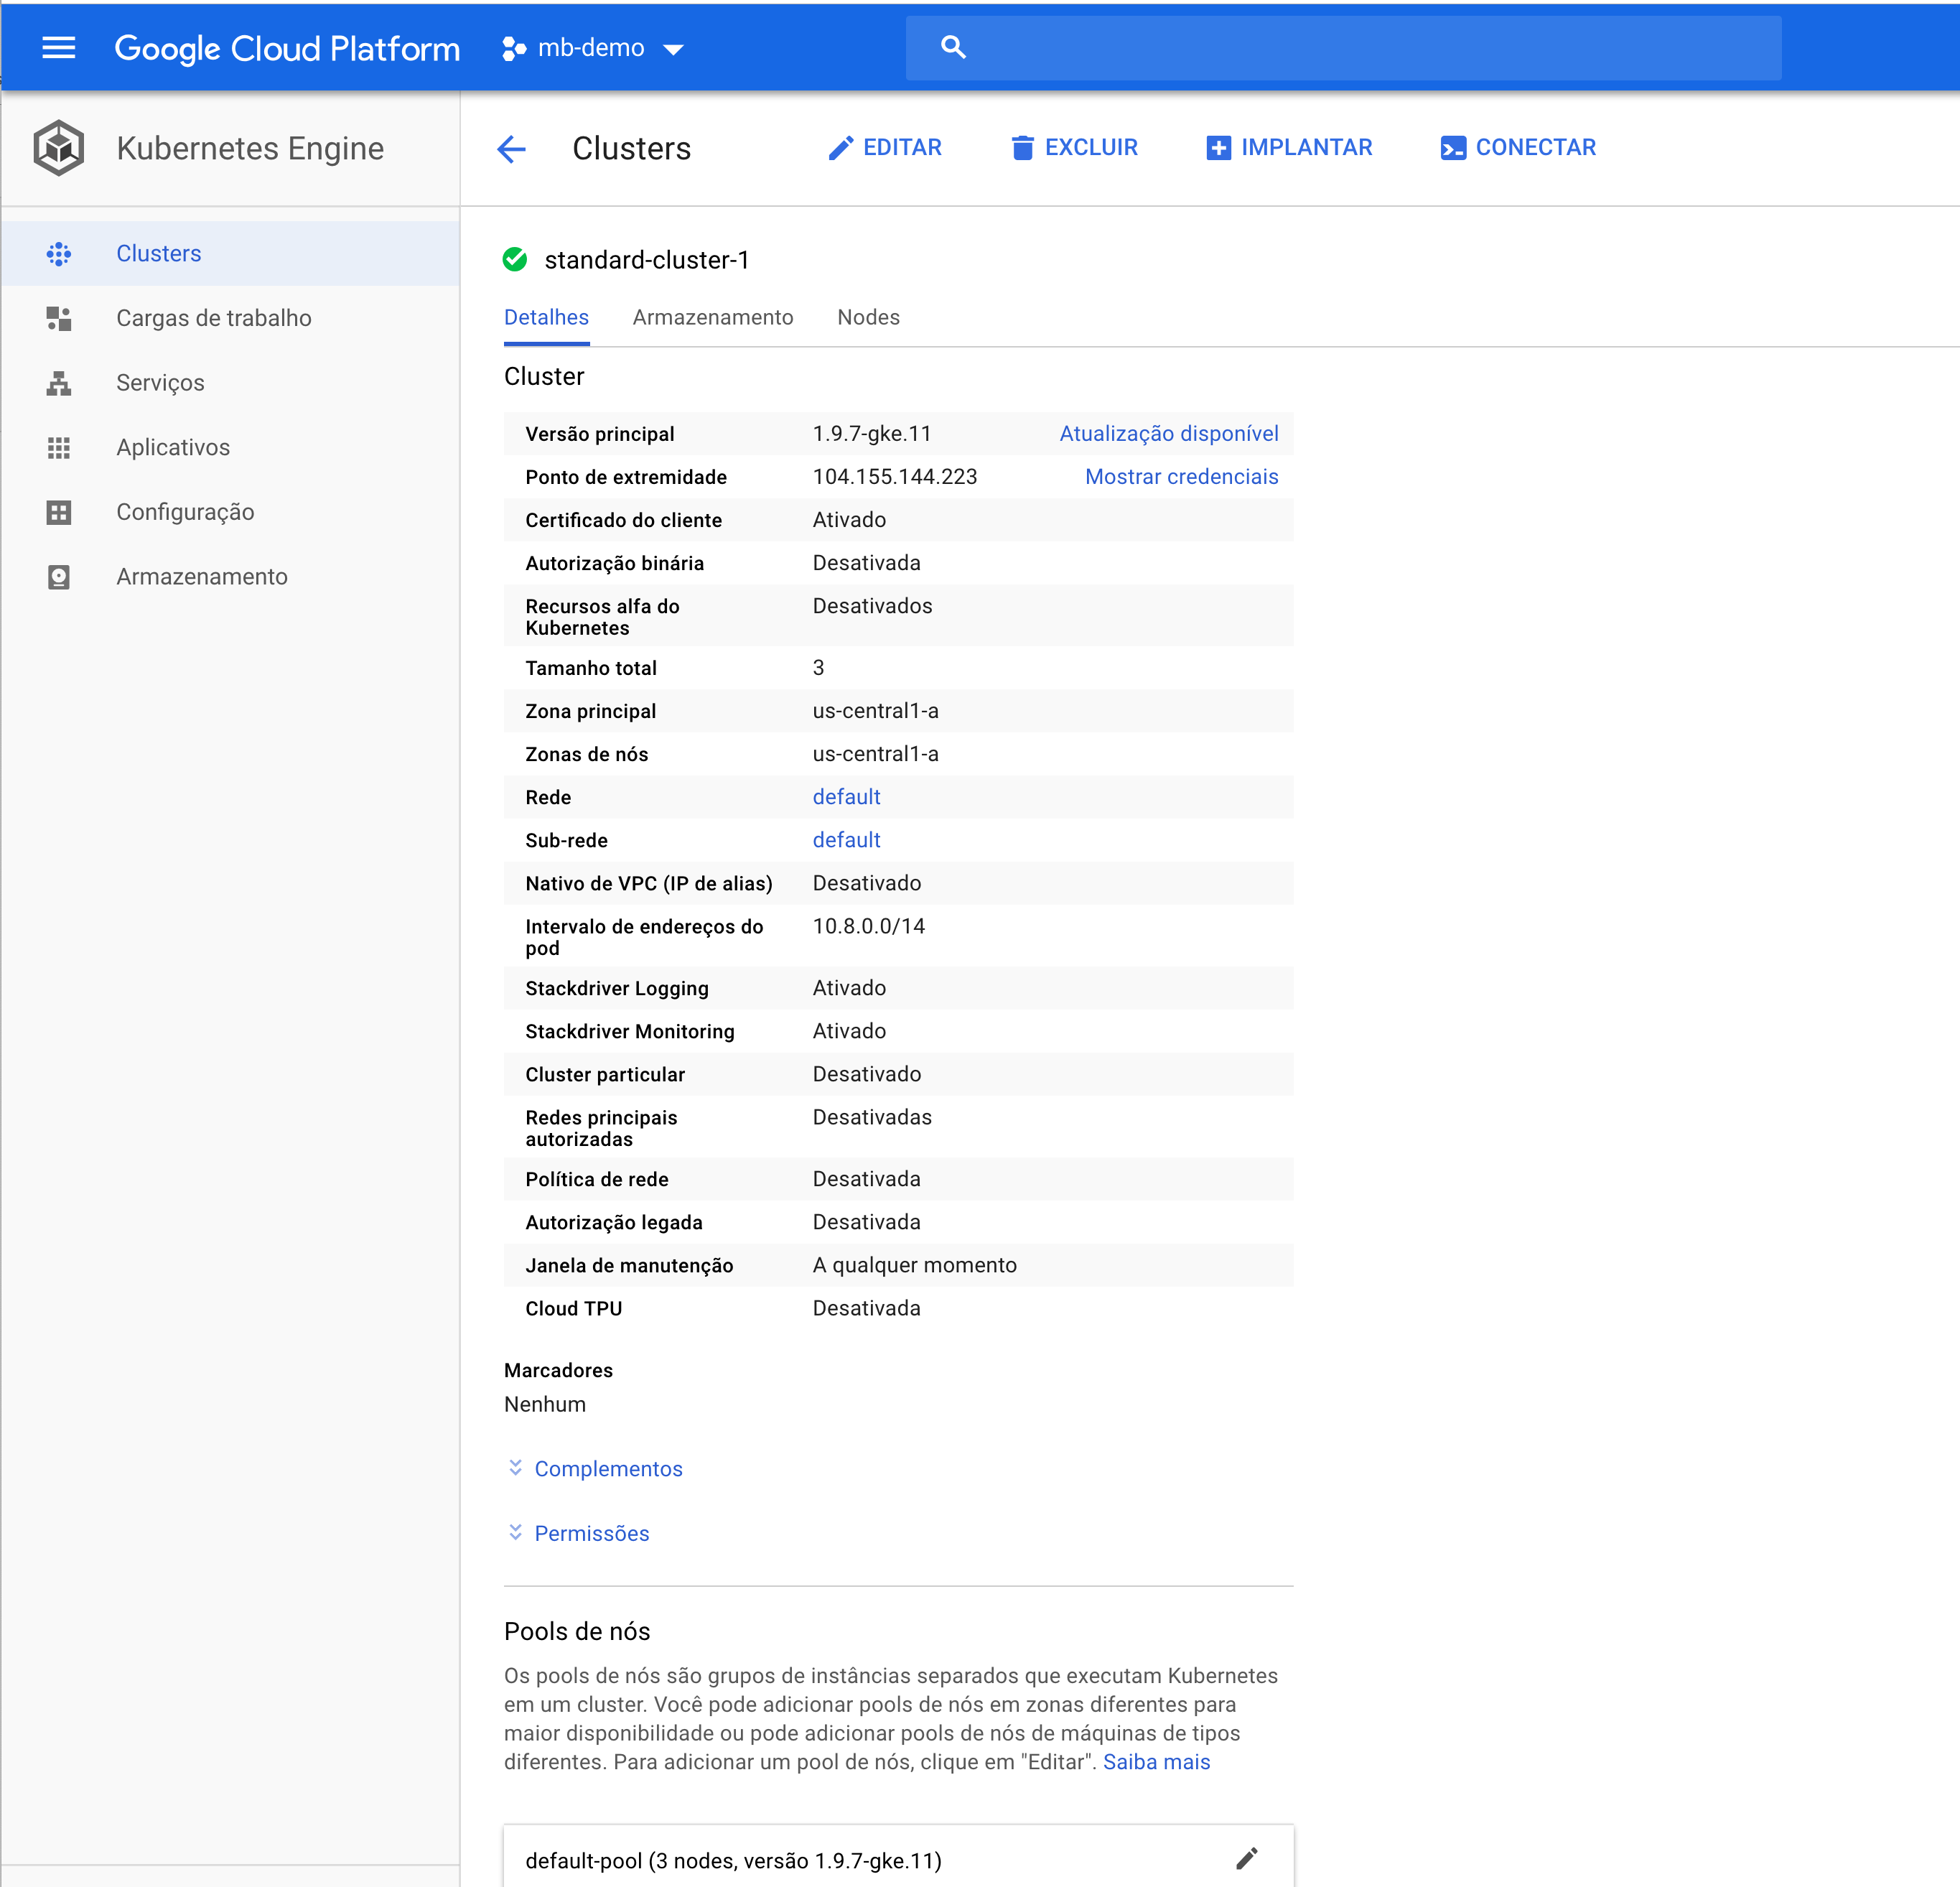
As result the necessary infrastructure was provisioned in the GCP:
This proccess also was made by ansible, but can be done by CLI too and by Maven.
The Dockerfile used was:
# Start with a base image containing Java runtime
FROM openjdk:8-jdk-alpine

# Add Maintainer Info
LABEL maintainer="Julio Cesar Damasceno <[email protected]>"

# Make port 80 available to the world outside this container
EXPOSE 80

# The application's jar file
ARG JAR_FILE=target/spring-boot-prometheus-k8s.jar

# Add the application's jar to the container
ADD ${JAR_FILE} app.jar

# Run the jar file
ENTRYPOINT ["java","-Djava.security.egd=file:/dev/./urandom","-jar","/app.jar"]
The CLI command:
docker build -t gcr.io/mb-demo-224014/spring-boot-prometheus-k8s:latest .
docker image push gcr.io/mb-demo-224014/spring-boot-prometheus-k8s:latest gcr.io/mb-demo-224014/spring-boot-prometheus-k8s:latest
Ansible Playbook module docker_image was not used because a BUG with Pythin 3.7 and MacOS lagacy Frameworks.
- name: Build Docker APP Docker Image
  hosts: localhost
  gather_facts: no
  connection: local

  tasks:
    - name: Include vars
      include_vars: ../vars/main.yml

    - name: Build image and tag image
      shell: docker build -t "{{ image_tag }}" ../../
      register: build

    - debug:
       msg: "Build container image {{ image_tag }} from Dockerfile"

    - name: Push image do gcr repo
      shell: gcloud docker -- push "{{ image_tag }}"
      register: push

    - debug:
       msg: "Push container image {{ image_tag }} to GCR Repository"

   # - name: Build an image and push it to a private repo
   #   docker_image:
   #     path: ../
   #     name: gcr.io/mb-demo-224014/spring-boot-prometheus-k8s
   #     tag: v3
   #     push: no
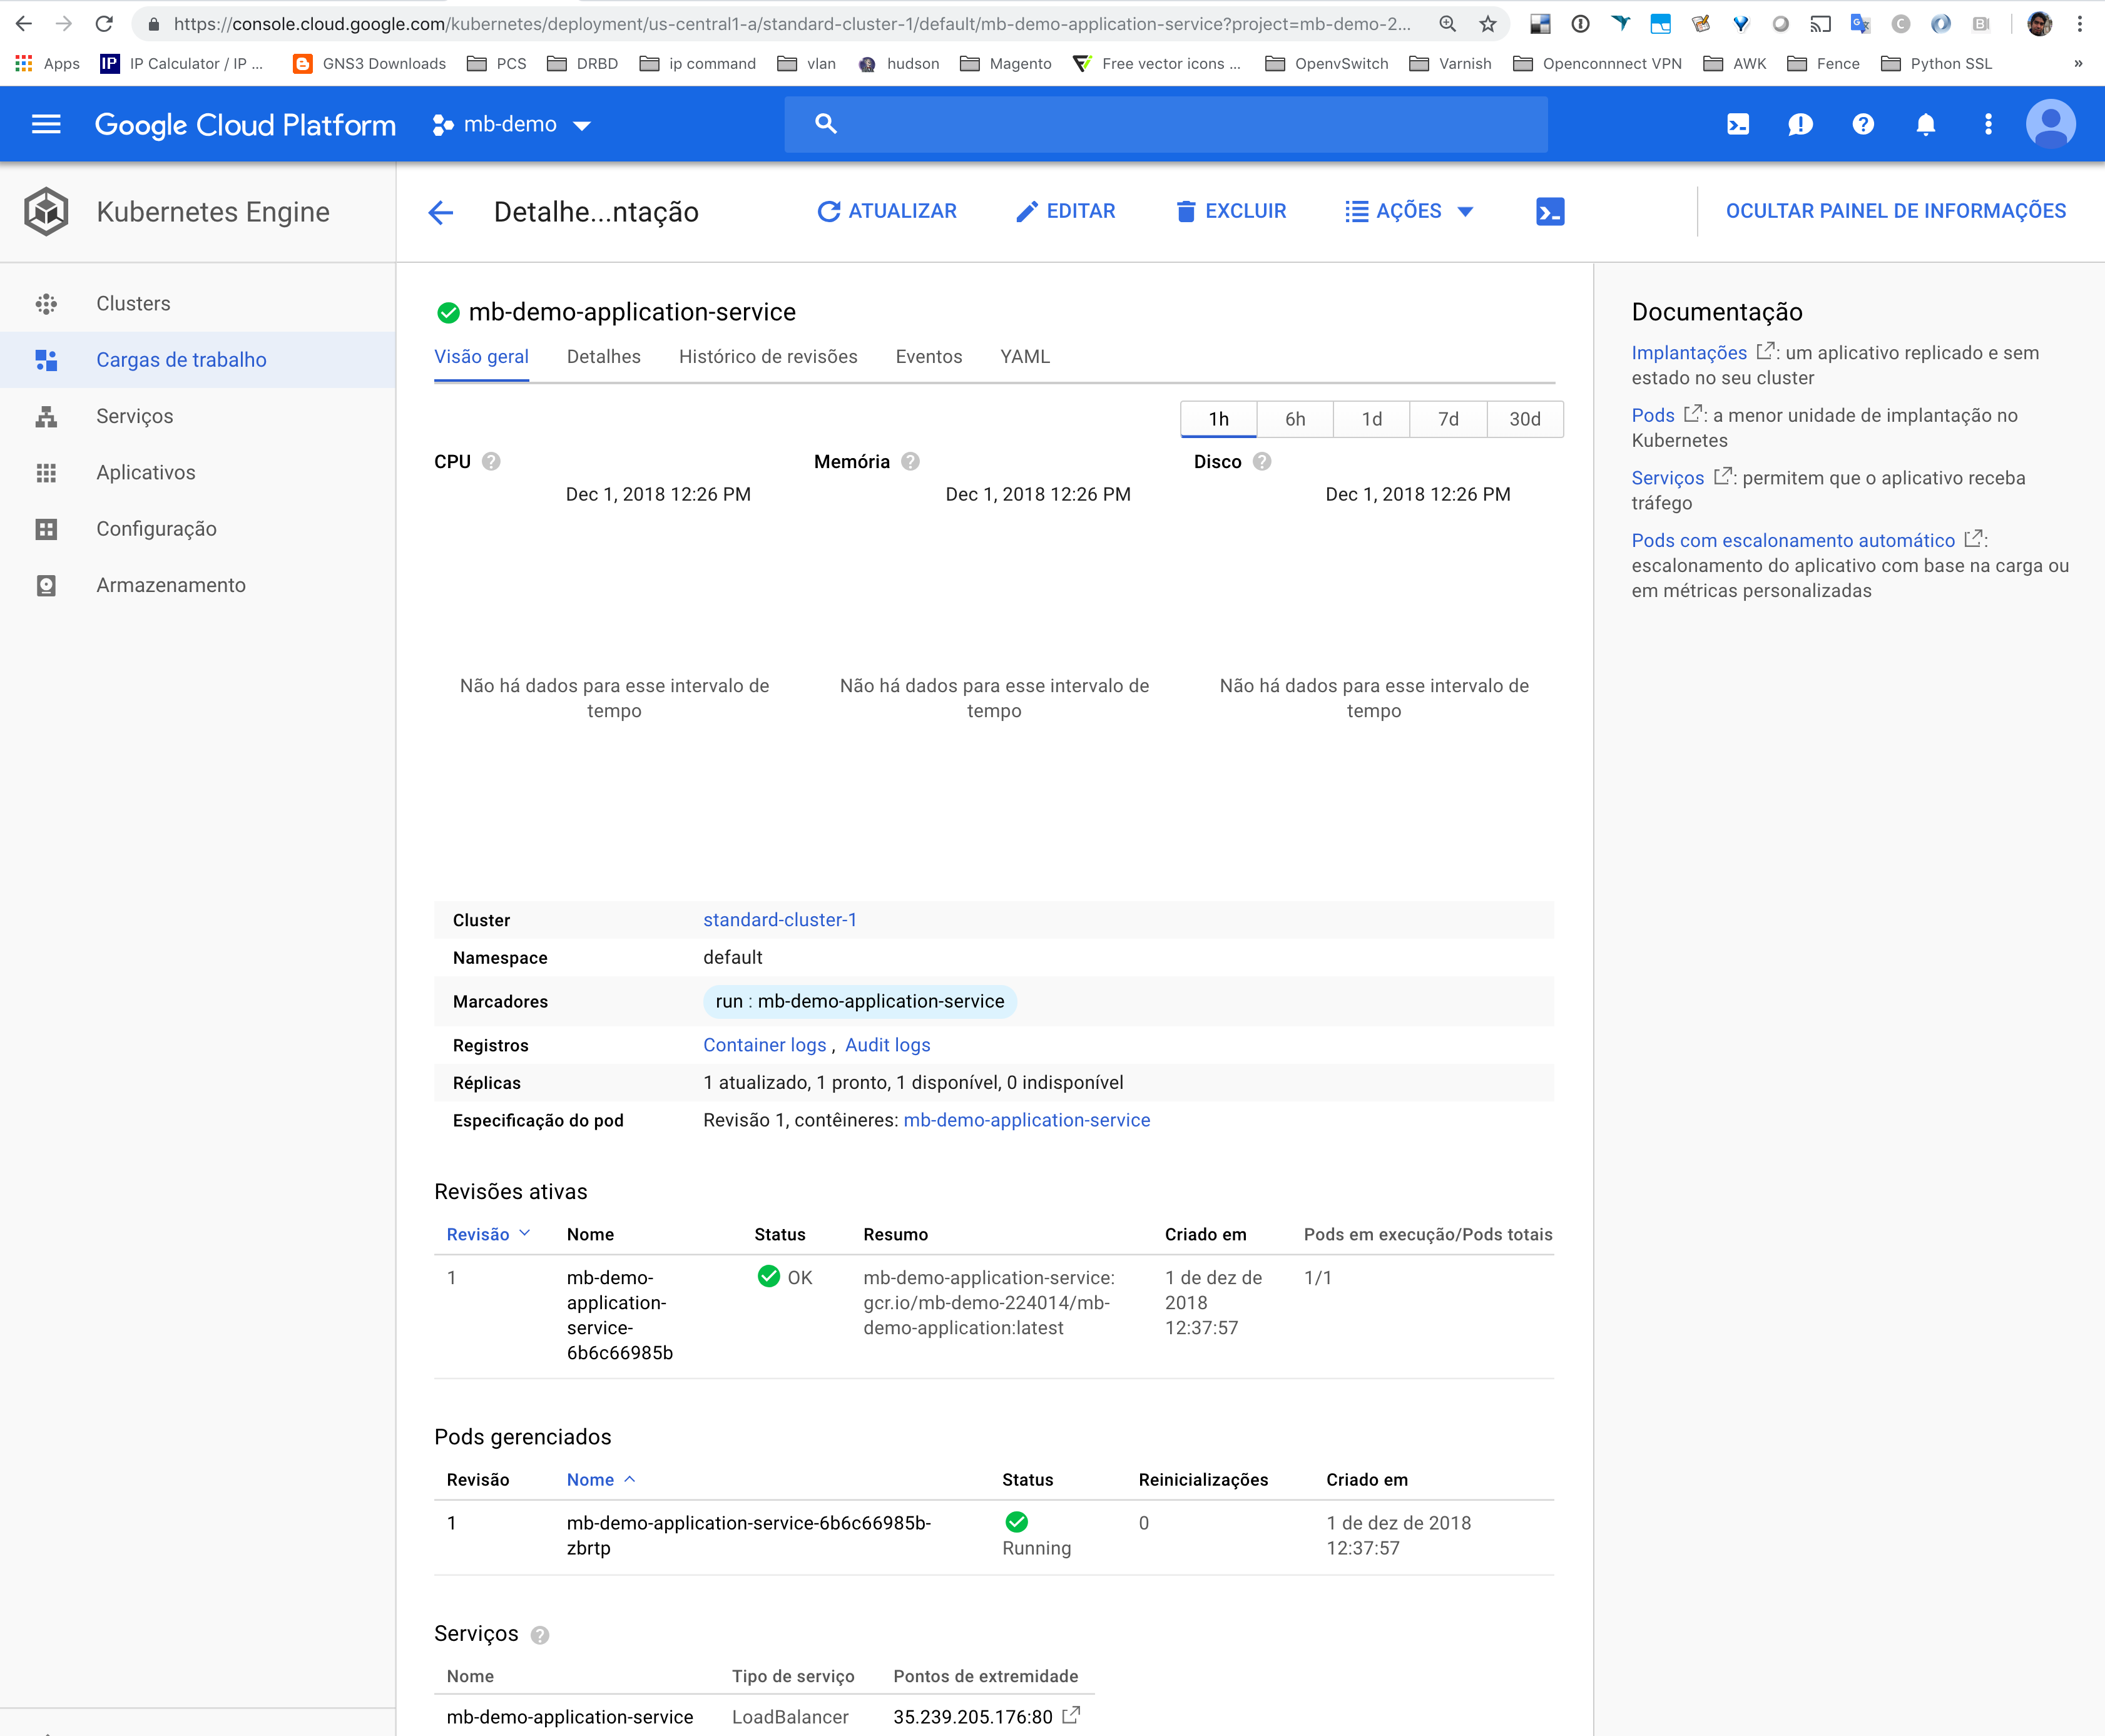
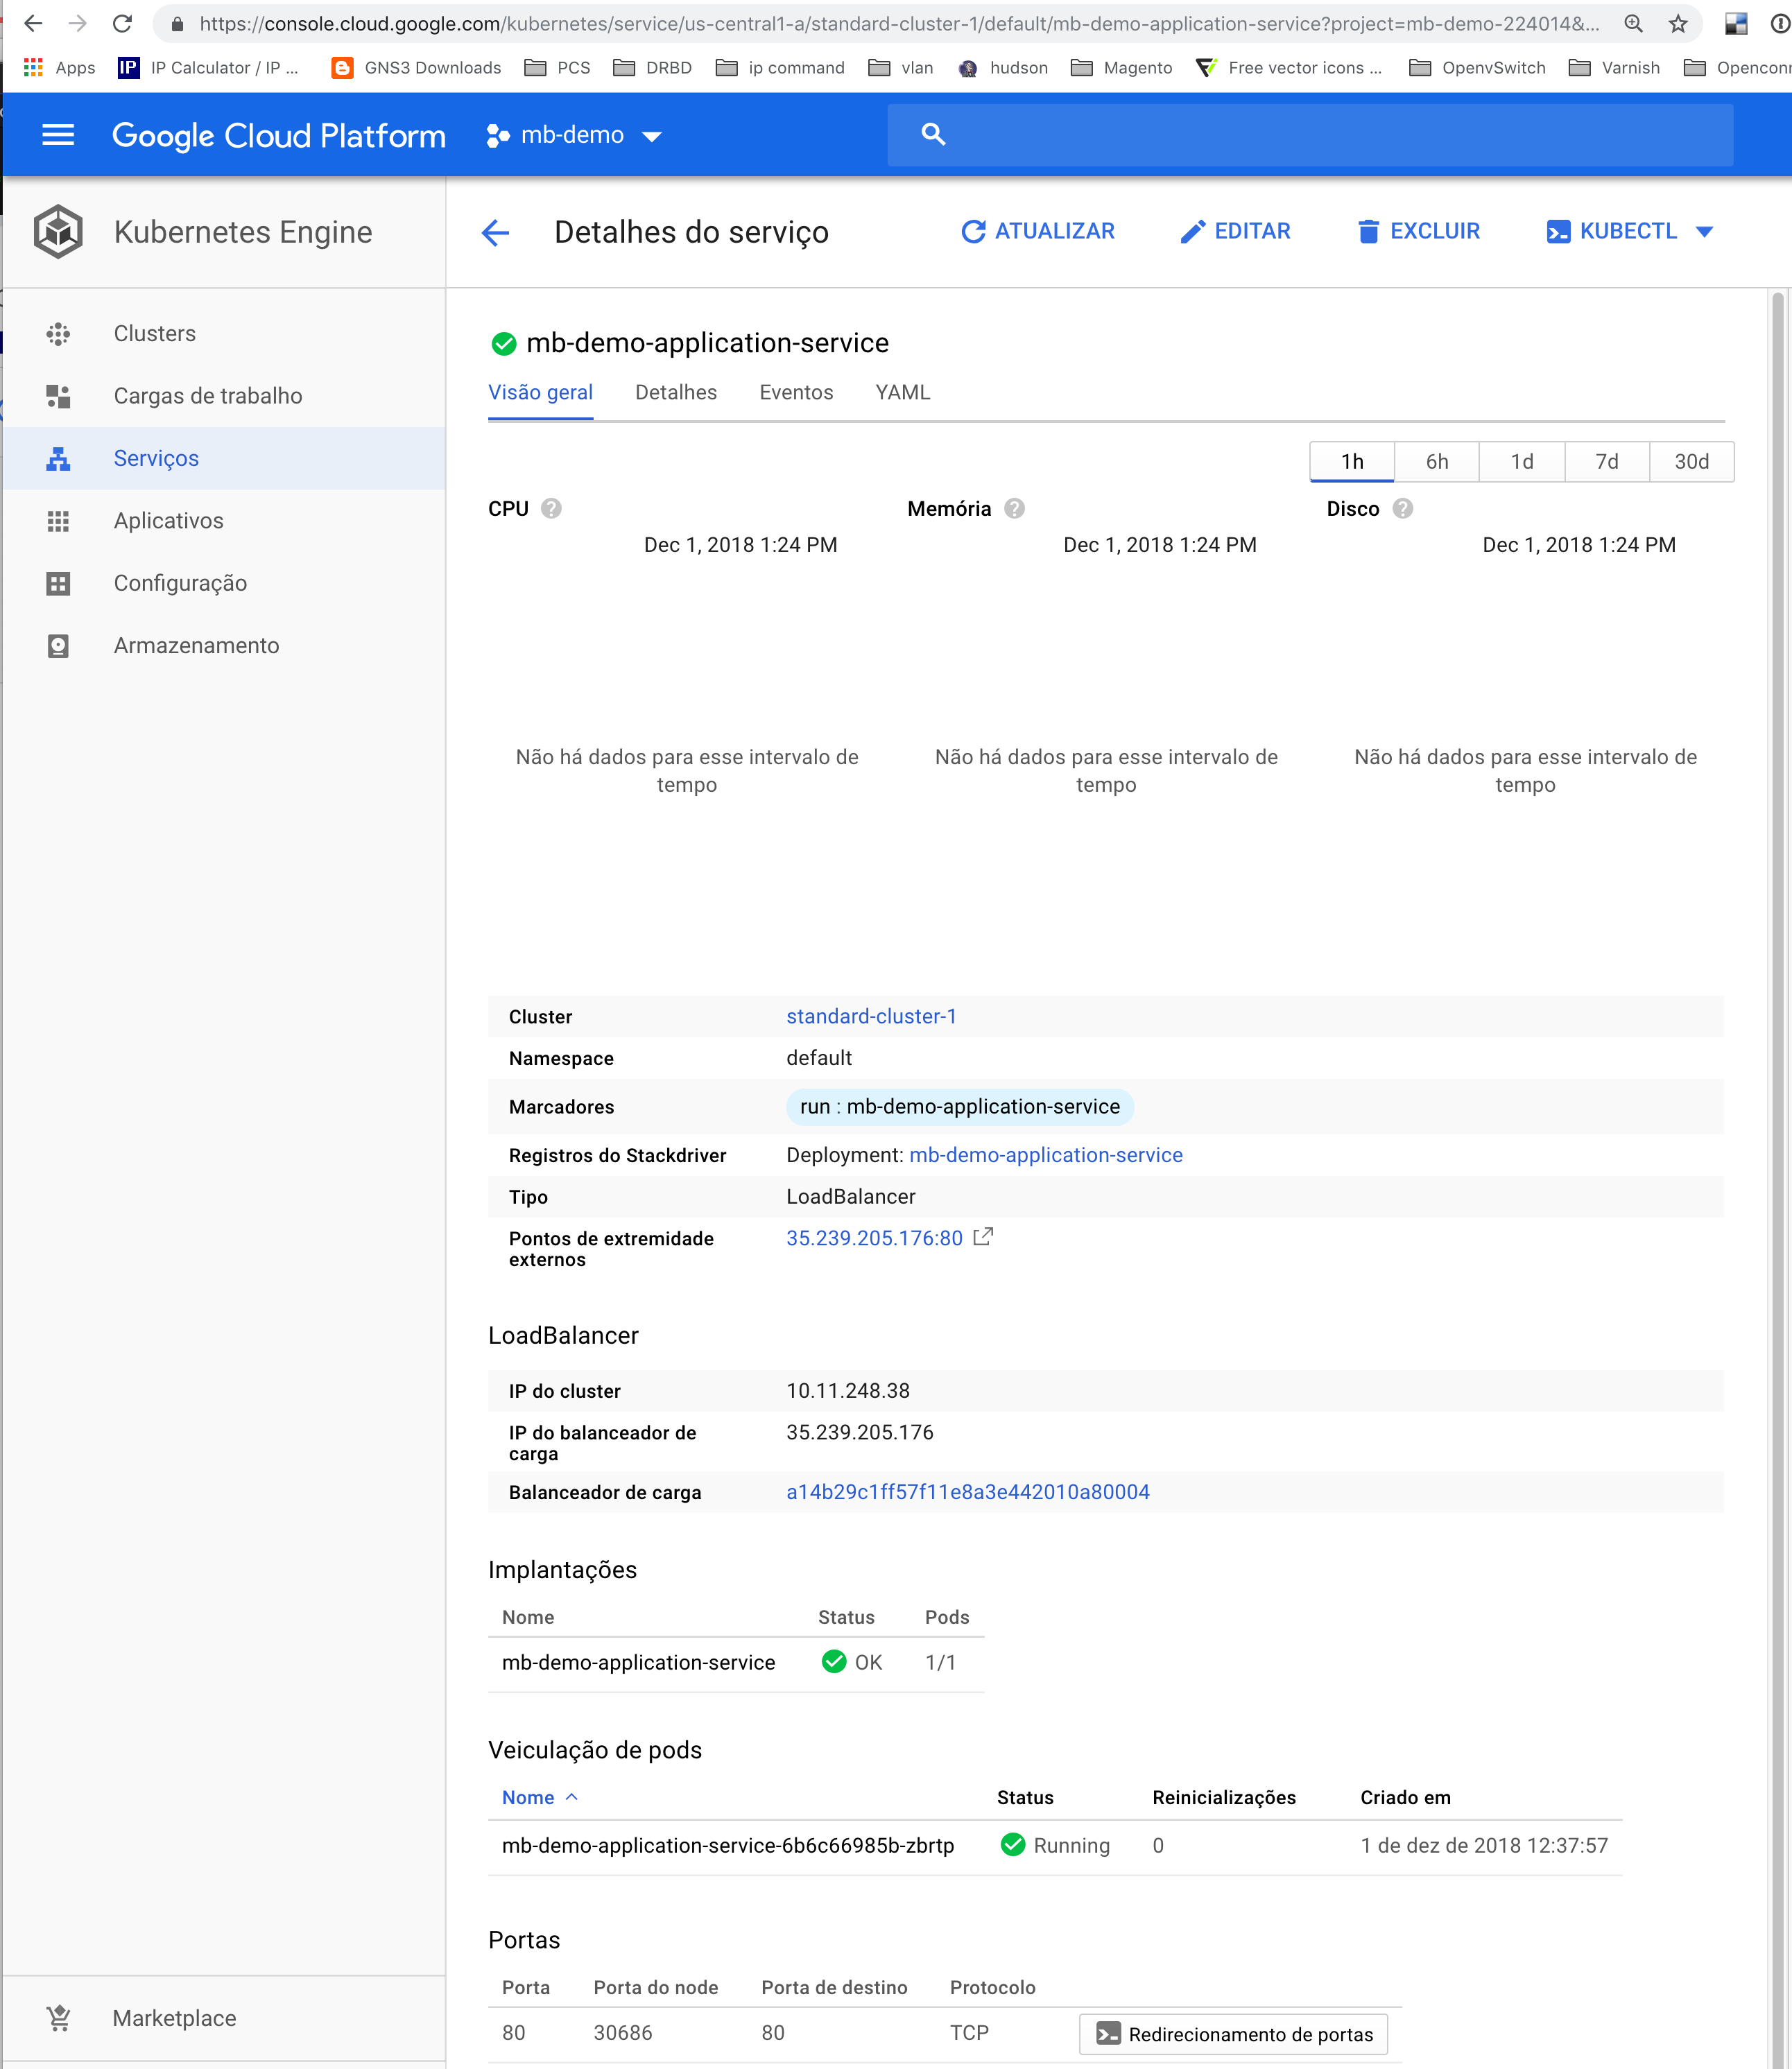
The k8s service was deployed in GCP k8s using ansible playbook as follow:
- name: Install K8s Servoce
  hosts: localhost
  gather_facts: no
  connection: local

  tasks:
   - name: Include ssh vars
     include_vars: ../vars/main.yml

   - name: create external IP
     gce_eip:
        name: mbird
        service_account_email: "{{ gcp_service_email }}"
        credentials_file: "{{ gcp_cred_file }}"
        project_id: "{{ gcp_project }}"
        region: "{{ gcp_region }}"
        state: present
     register: external_ip

   - debug:
       msg: "External IP: {{ external_ip }}"

   - name: verify service
     k8s:
       name: "{{ app_name }}"
       kind: Service
       api_version: v1
       namespace: default
       state: present
     ignore_errors: yes
     register: verify

   # MODULE WITH BUG, does not set the IP Address of Load Balancer Correctly
   # - name: create service description
   #   template:
   #     src: ../templates/service-k8s.yml.p2
   #     dest: /tmp/service-k8s.yml
   #   register: create
   #   tags:
   #       - template

   # - name: deploy k8s service
   #   shell: kubectl create -f /tmp/service-k8s.yml
   #   when: verify.failed
   #   register: create

   - name: deploy application
     shell: kubectl run "{{ app_name }}" --image="{{ image_tag }}" --port 80
     when: verify.failed
     register: has_deploy

   - name: expose application
     shell: kubectl expose deployment "{{ app_name }}" --type=LoadBalancer --port 80 --target-port 80 --load-balancer-ip="{{ external_ip.address }}"
     when: verify.failed
     register: has_exposed
To enable the Prometheus exporter the folling dependencies was configured in pom.xml file:
<!-- Prometheus built-in exporter -->
<dependency>
  <groupId>io.prometheus</groupId>
  <artifactId>simpleclient</artifactId>
  <version>0.5.0</version>
</dependency>
<dependency>
  <groupId>io.prometheus</groupId>
  <artifactId>simpleclient_spring_boot</artifactId>
  <version>0.5.0</version>
</dependency>
The SpringBoot main application must be configured with @EnablePrometheusEndpoint annontation.
The REST controlled must be configured to provide the prometheus metrics:
static final Counter covilhaRequests = Counter.build().name("covilha_requests_total").help("Total number of requests.").register();

static final Histogram covilhaRequestLatency = Histogram.build().name("covilha_requests_latency_seconds")
    .help("Request latency in seconds.").register();

@RequestMapping(value = "/covilha", method = RequestMethod.GET)
public ResponseEntity<?> getCovilhaTime() {
  // Increase the counter metric
  covilhaRequests.inc();
  // Start the histogram timer
  Histogram.Timer requestTimer = covilhaRequestLatency.startTimer();

  try {

    String timeString = tzService.getTimeByTimeZone("Europe", "Covilha");

    return new ResponseEntity<>(timeString, HttpStatus.OK);
  } finally {
    // Stop the histogram timer
    requestTimer.observeDuration();
  }
The prometheus metric was exposed on /prometheus context.


