-
Notifications
You must be signed in to change notification settings - Fork 314
FAQs
Xintao edited this page Aug 21, 2020
·
5 revisions
Related issues: #53
Description:
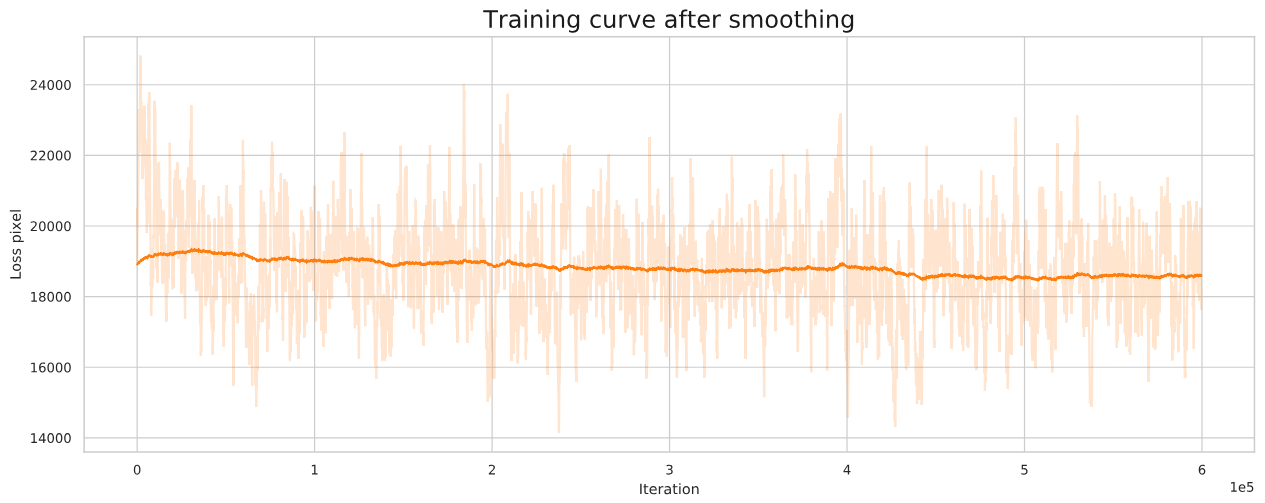
A typical training curve of 001_EDVRwoTSA_scratch_lr4e-4_600k_REDS_LrCAR4S is shown below. The loss curve fluctuates a lot and it seems that the loss does not converge. Someone may think the model is overfitting.
 A:
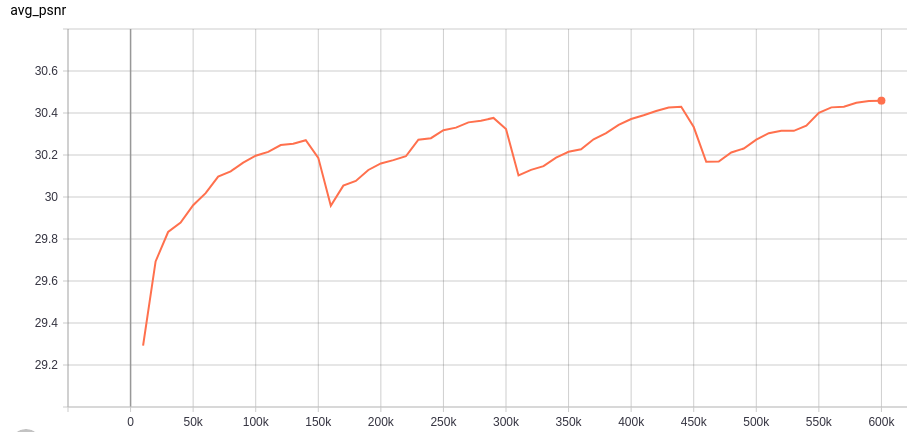
It is not an overfitting problem. Because when you evaluate the performance (the average PSNR on REDS4 datasets) of the checkpoints, you can get a curve shown below. The PSNR performance actually increases while the loss does not decrease. (The curve is cyclical due to the restart strategy we used during training.)

The next question is why the loss curve does not decrease. It does not make sense. In fact, there is nothing strange here. It is simply because of the display problem.
- The curve is not an average loss of all samples in a training patch. It is just a small part of the samples. Thus, the curve shows a high oscillation. Specifically, we use distributed training with eight GPUs. For simplicity, we only collect the loss in the master GPU instead of averaging the losses of all GPUs (In our case, 4/32 sample losses are collected.). Thus, The loss curve is influenced by the randomness of input data and shows a high oscillation.
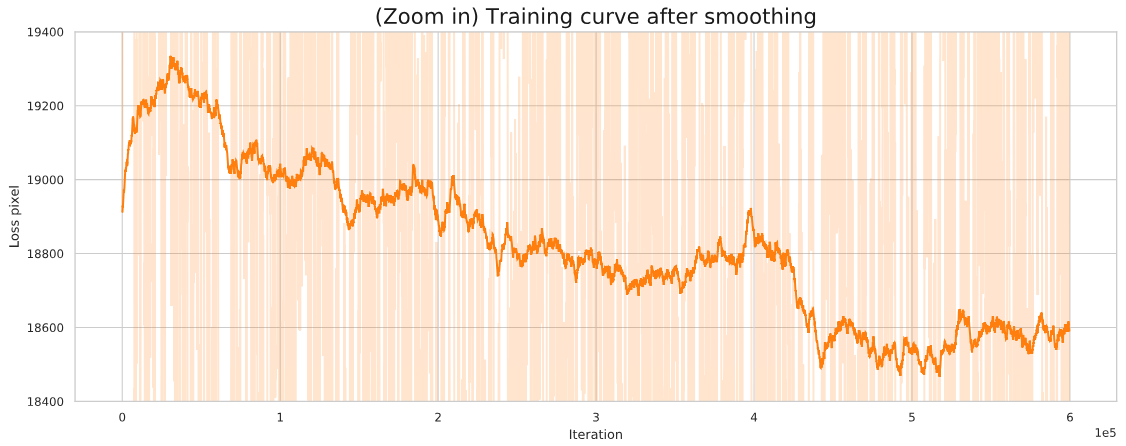
- The range of y-axis is too large (up to 10^5) to present subtle changes.
- The curve actually decreases after removing 'abnormal' points and smoothing. In specific, we truncate the loss values that are larger than 30000 and smooth the curve with 0.999. We obtain a smoothed curve and we can see a descending trend of the curve (especially from the enlarged version).

