How To Read Evergreen
This guide is meant as a quick reference for familiarizing yourself with reading results generated by the Evergreen continuous integration system. The first time you saw Evergreen, you may have thought something like "well green is probably good and red is probably bad but I have no idea what I'm looking at." Don't worry, though! You'll find navigating Evergreen to be simple (and fun) once you have some direction.
In order to understand how Evergreen is laid out, it is essential to grasp its hierarchy of organization. There are only a few main entities in Evergreen:
- Project -- a given git branch being tracked
- Version -- a single commit in a project
- Variant -- an environment for running tests in; each version in a project can be run on multiple variants (e.g. Windows/Linux/OSX/Solaris, Enterprise, SSL-enabled, etc.)
- Task -- a unit of work (usually a suite of tests or a compile); tasks are run in the environment established by the variant
In short, each commit to a git branch results in a new version, which runs multiple variants that each run a set of tasks.
There are three ways to get a view of the state of a project:
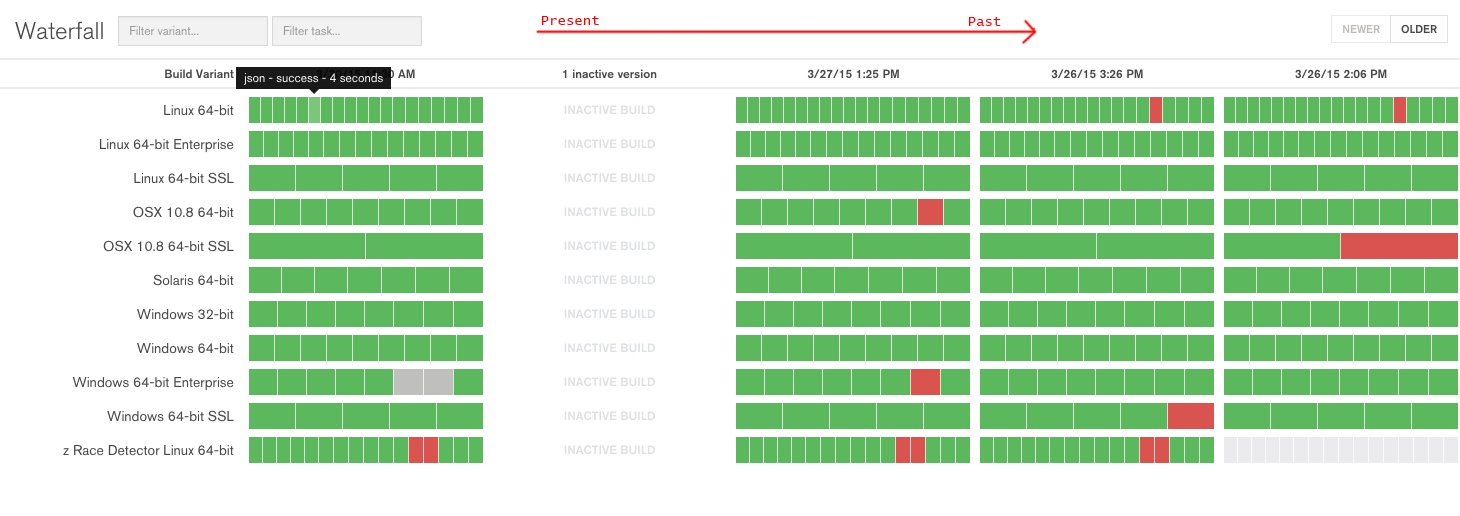 This is Evergreen's default view.
It displays a set of columns, each represents a version (commit) to the current project, the most recent commit being on the left (unlike it's namesake geographic formation, Evergreen's waterfall moves from left to right).
Each row in the column is a build variant, and each bar in a row is a task.
The tasks are colored green for success, yellow for in-progress, and red for failure.
Blank bars are not scheduled to run and gray bars are scheduled but waiting for execution.
You can click on any task in order to see its task page, which contains detailed information and logs.
This is Evergreen's default view.
It displays a set of columns, each represents a version (commit) to the current project, the most recent commit being on the left (unlike it's namesake geographic formation, Evergreen's waterfall moves from left to right).
Each row in the column is a build variant, and each bar in a row is a task.
The tasks are colored green for success, yellow for in-progress, and red for failure.
Blank bars are not scheduled to run and gray bars are scheduled but waiting for execution.
You can click on any task in order to see its task page, which contains detailed information and logs.
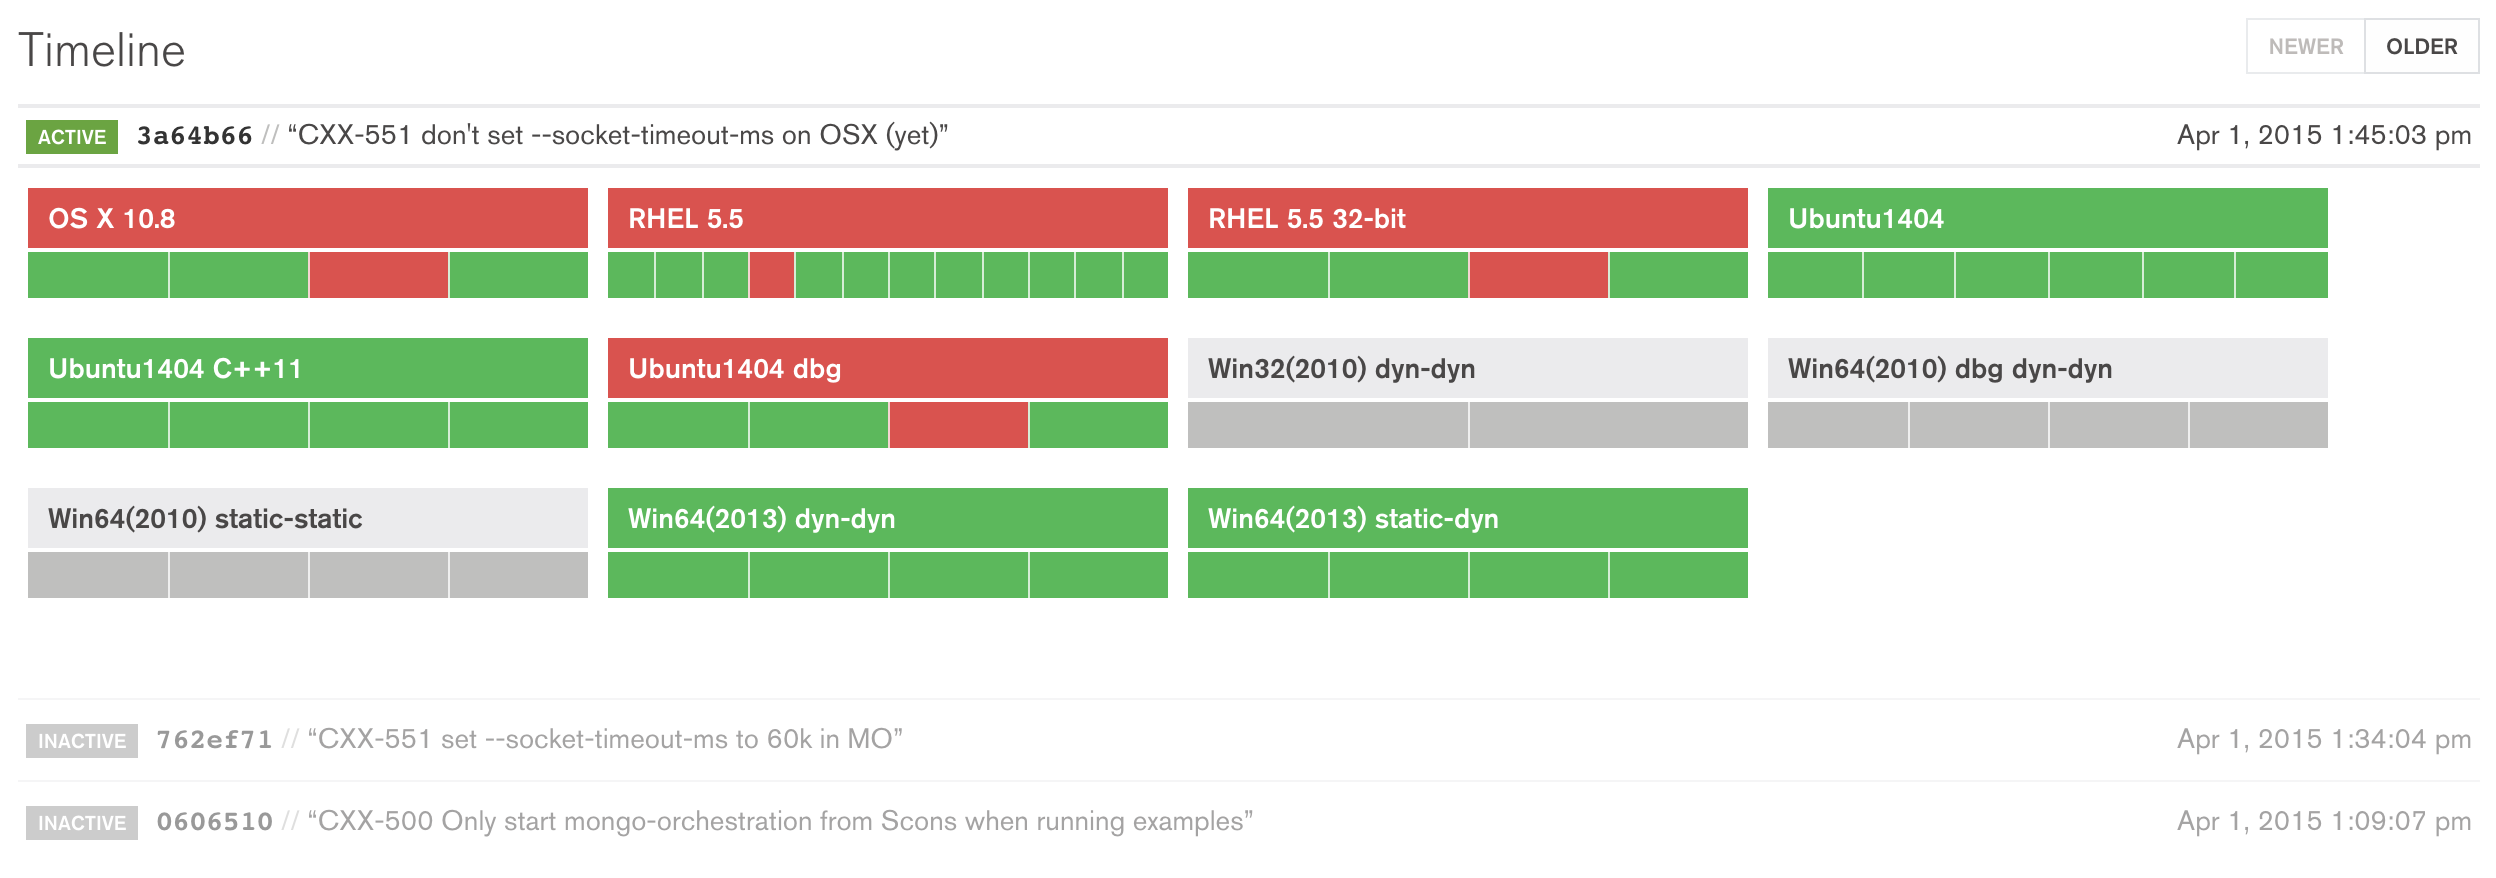 This view displays each version in a more verbose way than the waterfall page.
Each version is presented in its own section of the page, with each variant given its own box within that section.
The variant headers or tasks can be clicked on for more information.
This view displays each version in a more verbose way than the waterfall page.
Each version is presented in its own section of the page, with each variant given its own box within that section.
The variant headers or tasks can be clicked on for more information.
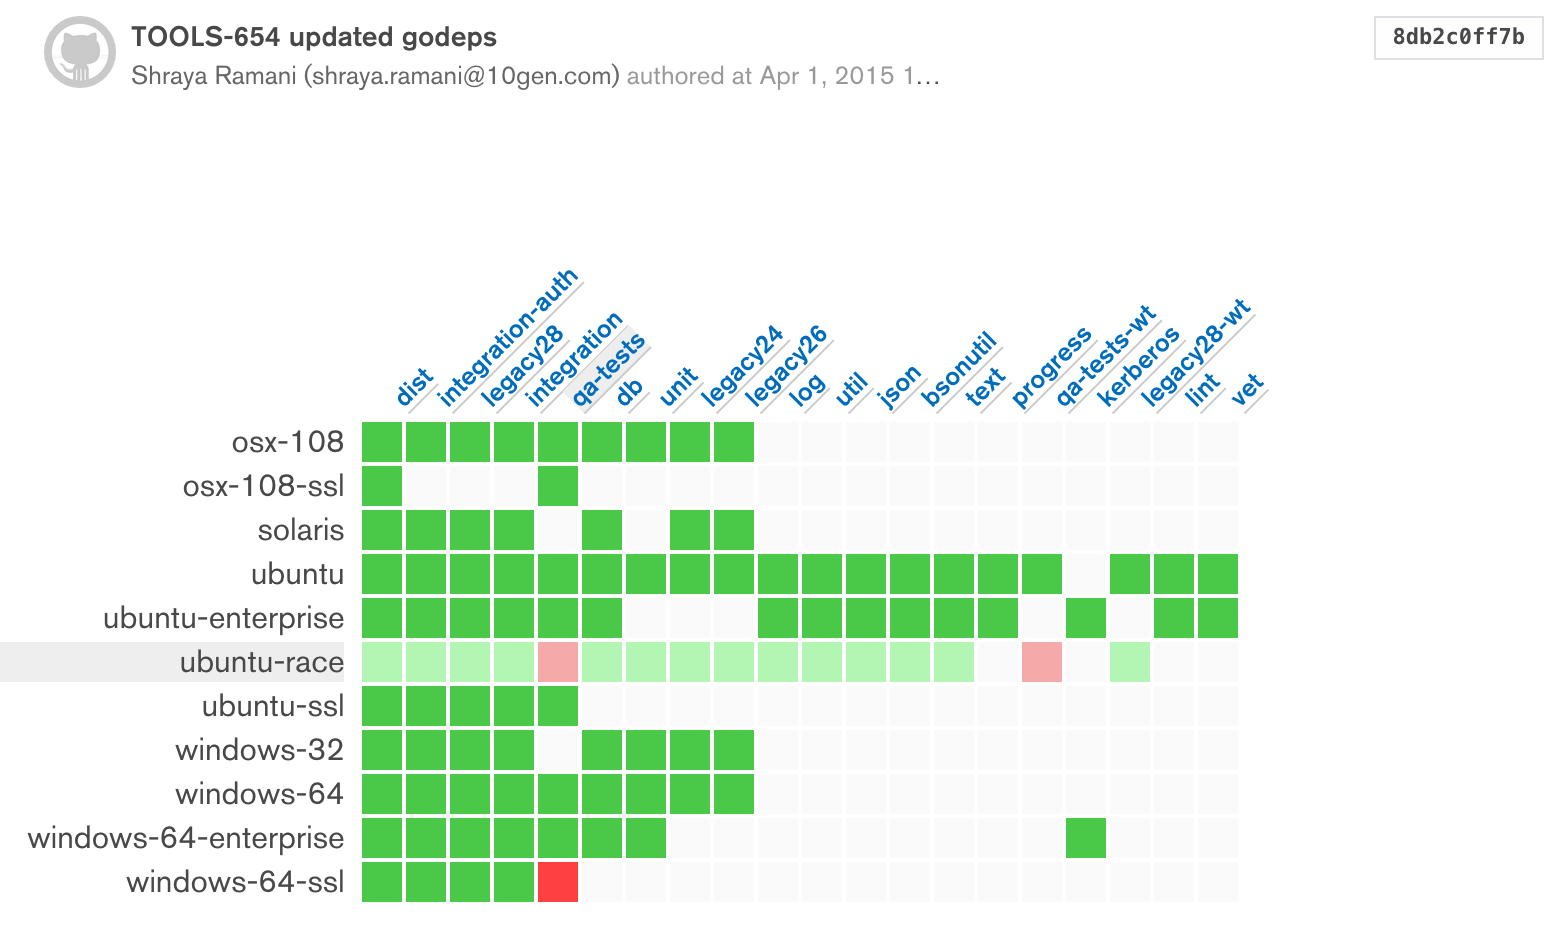 This view shows the state of a single version.
It displays each task as a square in a grid of build variants plotted against tasks.
Clicking on a square will open a pop-up with task history information.
This view should be more familiar to users of other continuous integration tools, like Jenkins.
This view shows the state of a single version.
It displays each task as a square in a grid of build variants plotted against tasks.
Clicking on a square will open a pop-up with task history information.
This view should be more familiar to users of other continuous integration tools, like Jenkins.
 The version page is mostly here to get you to other pages.
The page contains links to each build variant and task created for the given version.
A panel on the right displays a condensed history of the versions for the commits surrounding it.
The version page is mostly here to get you to other pages.
The page contains links to each build variant and task created for the given version.
A panel on the right displays a condensed history of the versions for the commits surrounding it.
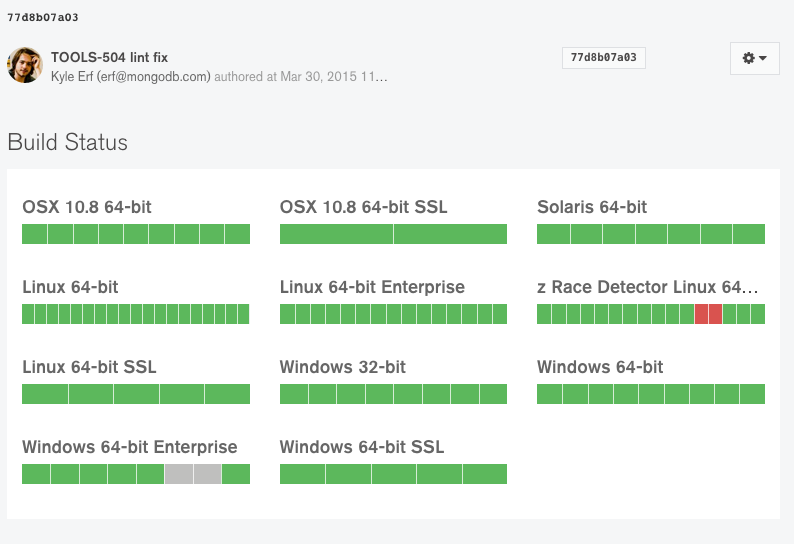
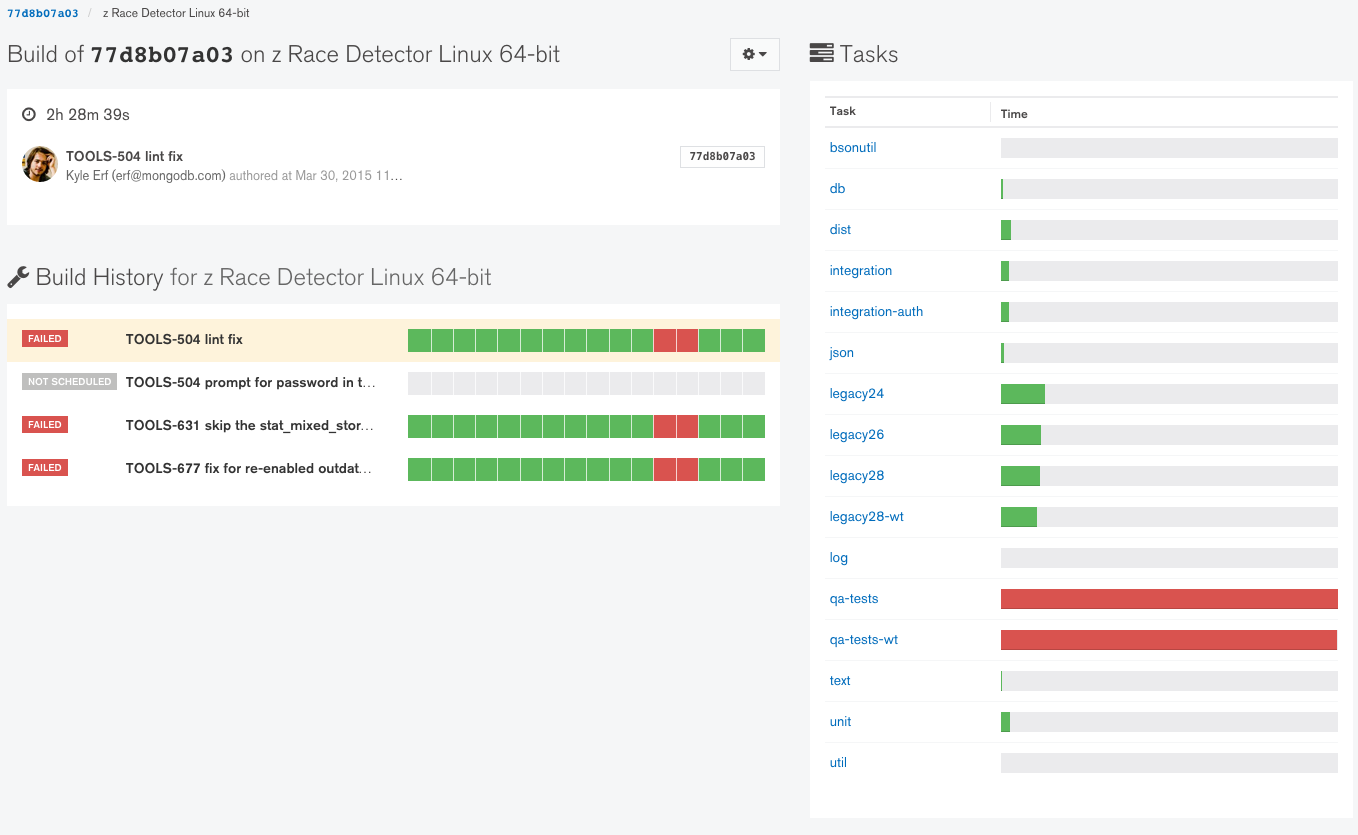 The build page shows the status of one of a version's variants (e.g. Windows32 on commit 0bed4262da).
This page shows the status and time taken by each of the variant's tasks.
The most recent completely-passing version for a build is given in the lower-left.
The build page shows the status of one of a version's variants (e.g. Windows32 on commit 0bed4262da).
This page shows the status and time taken by each of the variant's tasks.
The most recent completely-passing version for a build is given in the lower-left.
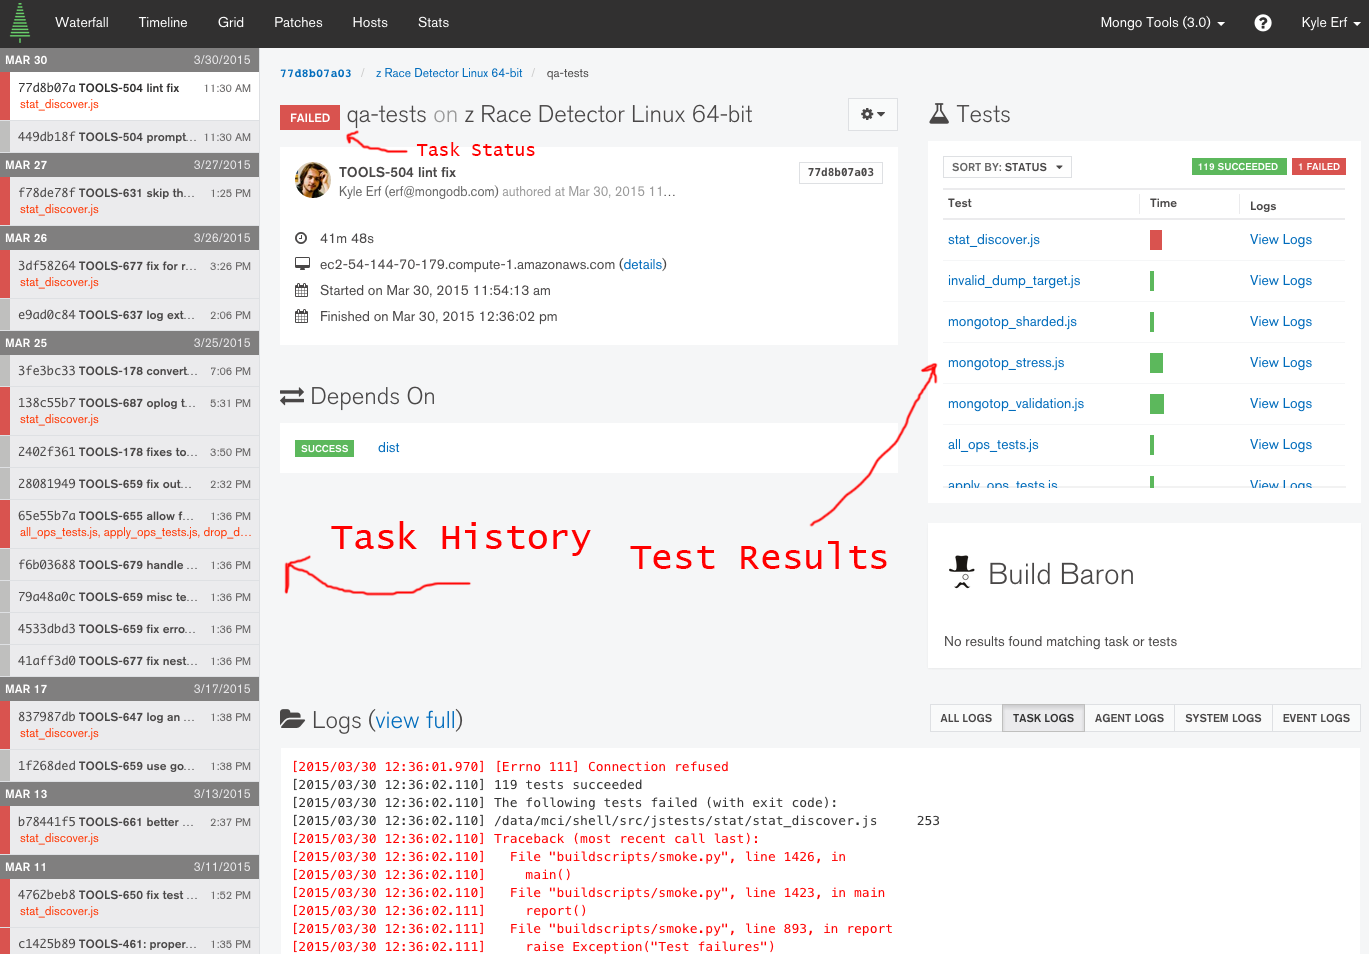 This is probably the page you'll be spending the most time with.
Versions and build variants are the skeleton holding up Evergreen; tasks are the organs and muscles.
This is probably the page you'll be spending the most time with.
Versions and build variants are the skeleton holding up Evergreen; tasks are the organs and muscles.
The task page contains execution information of one task for one variant in a version. It offers the results and logs of the tests executed as part of the tasks (right panel) and general logs from the task's execution (bottom panel). On the left side of the screen, you can see the history for that task across version, along with test failure information. This sidebar is your best friend when it comes to diagnosing test failures.