

Version 0.20, soon to be released, includes a number of fundamental changes. It is safe to say that any existing code that uses Tablesaw will require modifications. We regret the inconvenience that results.
Two of the biggest changes are the removal of the Smile interface, and the removal of support for several numeric column types. In the new release we will support only double precision floating point columns. We may at some time revert those changes, but for now they let us focus on Tablesaw's core functionality in manipulating tabular datasets.
The new version also represents a significant improvement in several dimensions. All the changes are summarized here, but it's worth mentioning a couple:
Overall, interfaces for tables and columns are more consistent, general, powerful, and robust. Test coverage is up from 44% to 70%. When the release goes to Maven Central, documentation will be better, too. Overall, this release is a big step forward for Tablesaw. We hope you agree.
Thank you.
Tablesaw is a Java dataframe similar to Pandas in Python, and the R data frame. If you work with data in Java, it may save you time and effort.
Tablesaw also supports descriptive statistics and data visualization.
You can use tablesaw-core, which is the dataframe library itself, by adding a dependency:
<dependency>
    <groupId>tech.tablesaw</groupId>
    <artifactId>tablesaw-core</artifactId>
    <version>0.11.6</version>
</dependency>
You can also add a dependency for tablesaw-plot to use the plotting capability.
- We also recommend trying Tablesaw inside Jupyter notebooks, which lets you experiment with Tablesaw in a more interactive manner. Get started by installing BeakerX and trying the sample Tablesaw notebook
- Please see our documentation page: https://jtablesaw.github.io/tablesaw/
- Import data from RDBMS and CSV files, local or remote (http, S3, etc.)
- Combine files
- Add and remove columns
- Sort, Group, Filter
- Map/Reduce operations
- Descriptive stats: mean, min, max, median, sum, product, standard deviation, variance, percentiles, geometric mean, skewness, kurtosis, etc.
- Scatter plots
- Line plots
- Vertical and Horizontal Bar charts
- Histograms
- Box plots
- Quantile Plots
- Pareto Charts
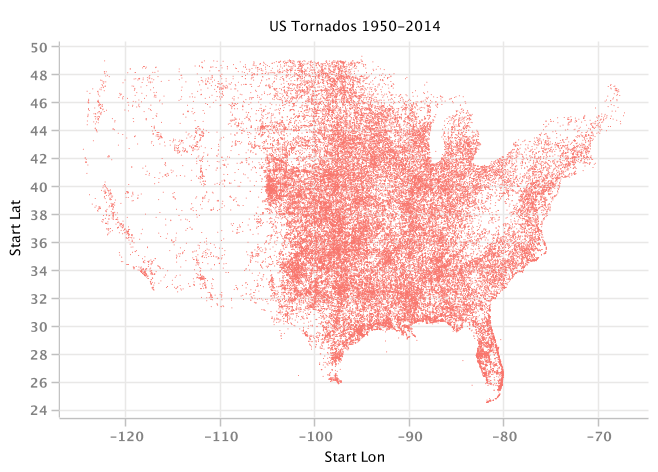
Here's an example where we use XChart to map the locations of tornadoes:
If you see something that can be improved, please let us know.