-
Notifications
You must be signed in to change notification settings - Fork 8
Basic Logistic Regression
It is important to know that regression is not always the most effective of solutions.
The gradient descent method need not necessarily always converge to the global minima.
This further implies that linear regression as its name suggests, suits best for linear curves which have only a single global minima (since the function for linear regression is always convex) which in turn gives the best fit straight line.
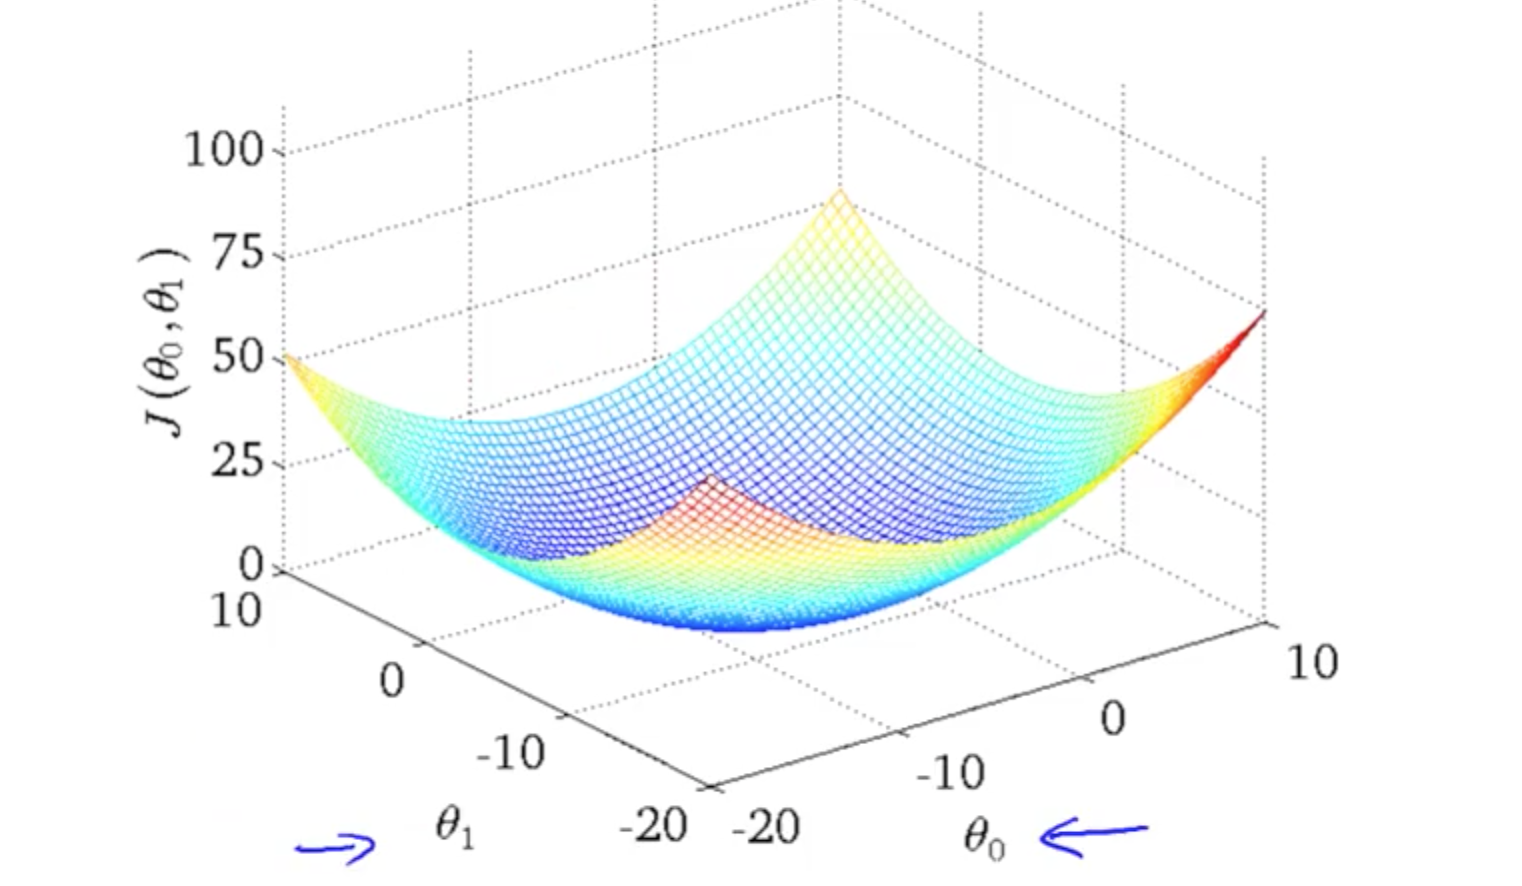
This limits our curves to straight lines, and hence comes the need for more complicated methods so that we can trace polynomial curves.
There are many regression techniques that suit polynomial curves. The most well known ones are polynomial regression and Logistic regression. While polynomial regression is used for continuous curves, Logistic regression is made for classification problems.
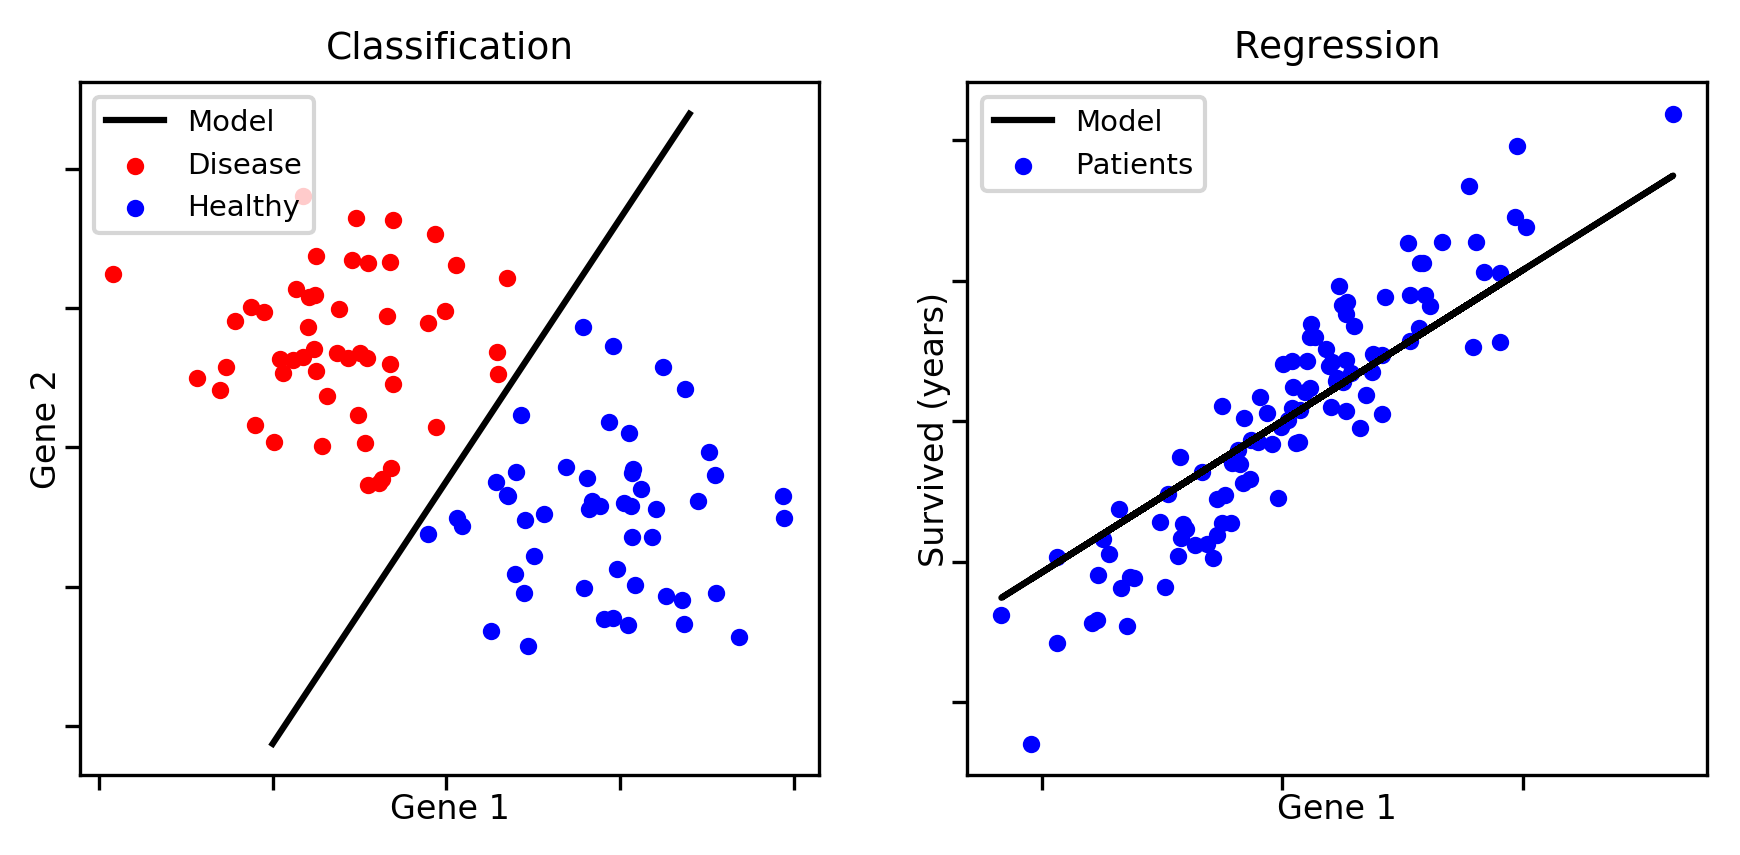
There are certain problems that require prediction of discrete values as shown above.
For example: It could be a prediction of diseases, such as breast cancer which is dependent on a single feature such as tumor size(shown below), or a disease dependent on 2 features such as shown above.
Classification problems need not necessarily be just Yes or No like the previous example(Binary Classification Problem). It could also be a Multiple Classification Problem, that is, it could have more than just 2 classifications, such as being diagnosed with Type 2 cancer or Type 3 cancer(Multiple Classification Problem).
We could attempt such problems using Linear and Logistic Regression.
The attempt is naive and you will see soon why.
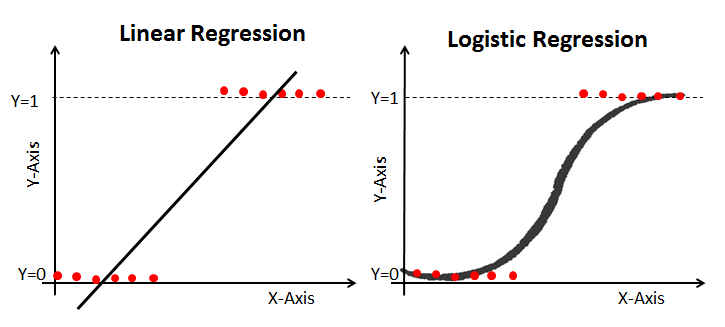
When we use Linear Regression for such classification Problems, the best fit curve would end up like this:
This obviously is not the ideal curve. Lets break it down point by point.
Imagine thinking like the learning algorithm, we start from the extreme left as we fill in the points, that are all at 0, the best fit line would be the x axis or y=0. But when a point appears at y=1, a change is noticed.
This point changes the gradient of the linear curve(straight line), increasing the gradient. As the points at y=1 increases, the curve gains gradient and eventually tilts to the line as seen above. The issue with such a approach is that the change is not drastic enough to penalize the parameters. Also seldom does it happen that classification problems have linear solutions.
Hence the need for Logistic Regression.
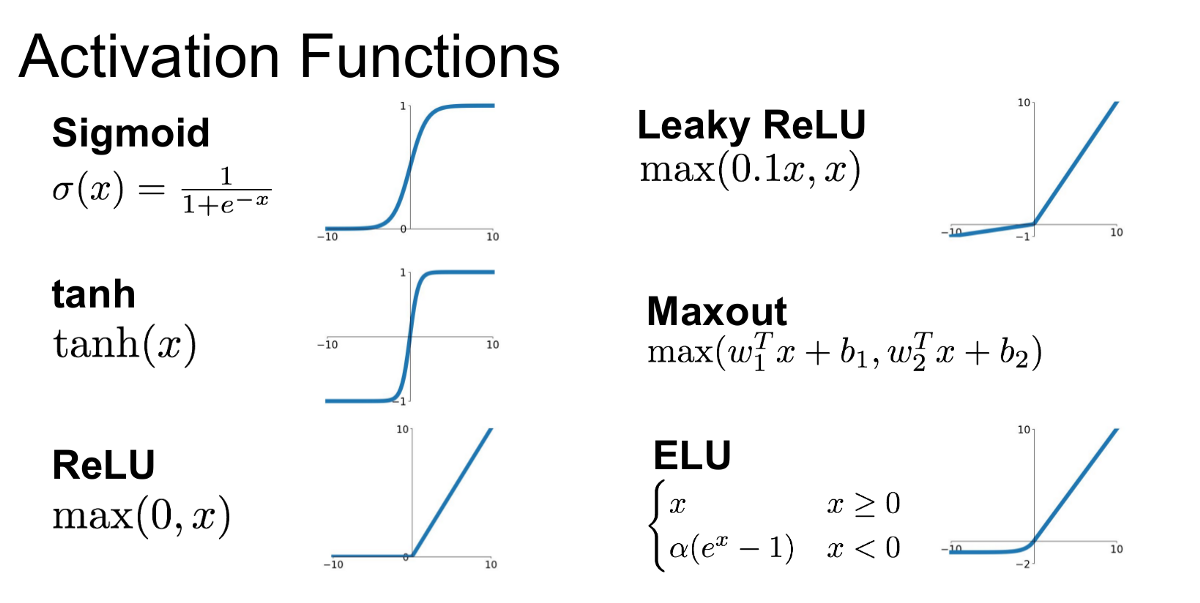
For Logistic Regression our goal then becomes to find a function that penalizes the the curve such that a point would change the gradient but at the same time maintain and satisfy the previous points. The few functions that would satisfy the property are:
Such functions are called the activation Functions. The most commonly used one is the sigmoid function (due to its extended use in neural networks).
The activation functions end up as our hypothesis and the values are inserted into the same for the ideal curve.
Since we are still predicting the values, our output is still a prediction, in other words any point that lies in the curve would have our hypothesis function provide a probabilistic answer instead of an ideal "Yes or No". In such cases, we would have to provide a threshold value that segregates the yes from the no. Ideally the ones above is a yes(Higher place value) and the ones below a no(Lower place value).
Such a prediction based on the threshold value gives a line that provides a boundary between the 2 classes otherwise known as the decision boundary. Note that the decision boundary is not dependent on the training set but instead on the hypothesis function
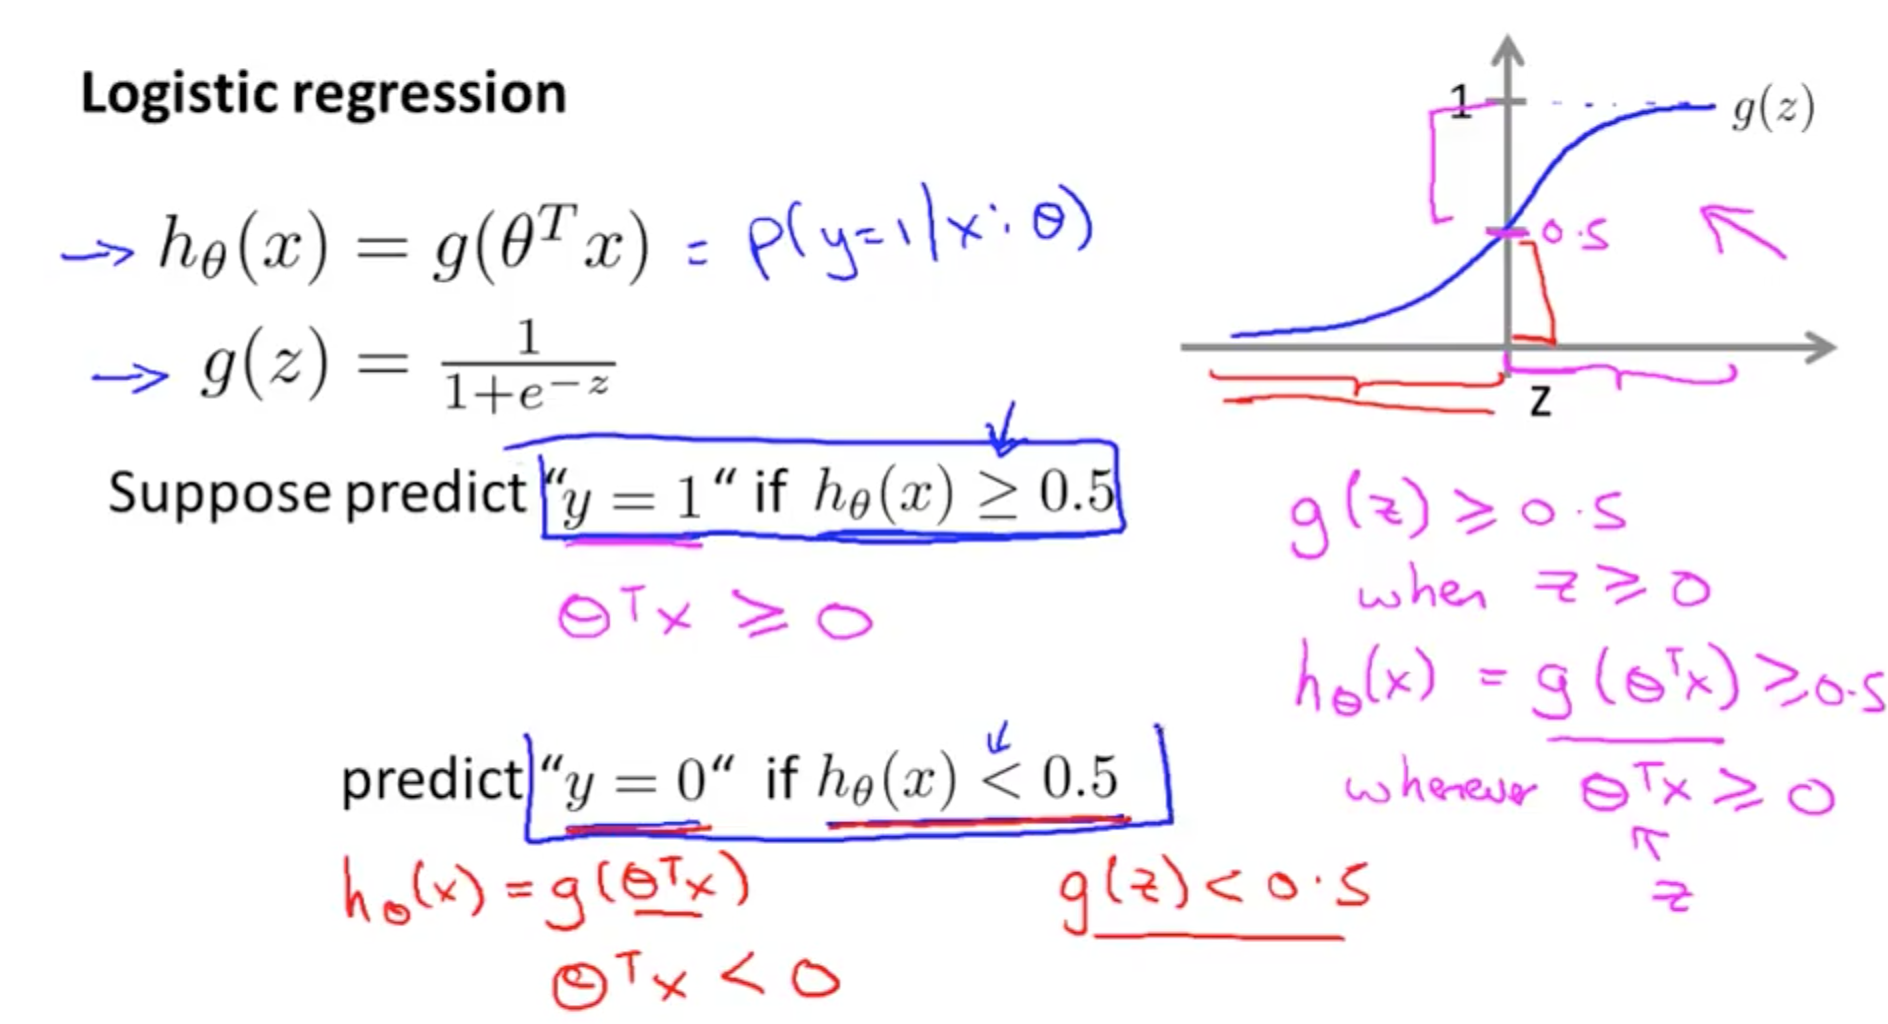
In the above image note the variable z is used to denote the vector multiplication of the features with its respective parameters. Again the number of features will determine whether its a Logistic Single Variate Regression or a Multi-Variate Regression.
Single Variate Logistic regression would have a Linear Decision Boundary while Multi-Variate Logistic Regression would have a Non Linear Decision Boundary
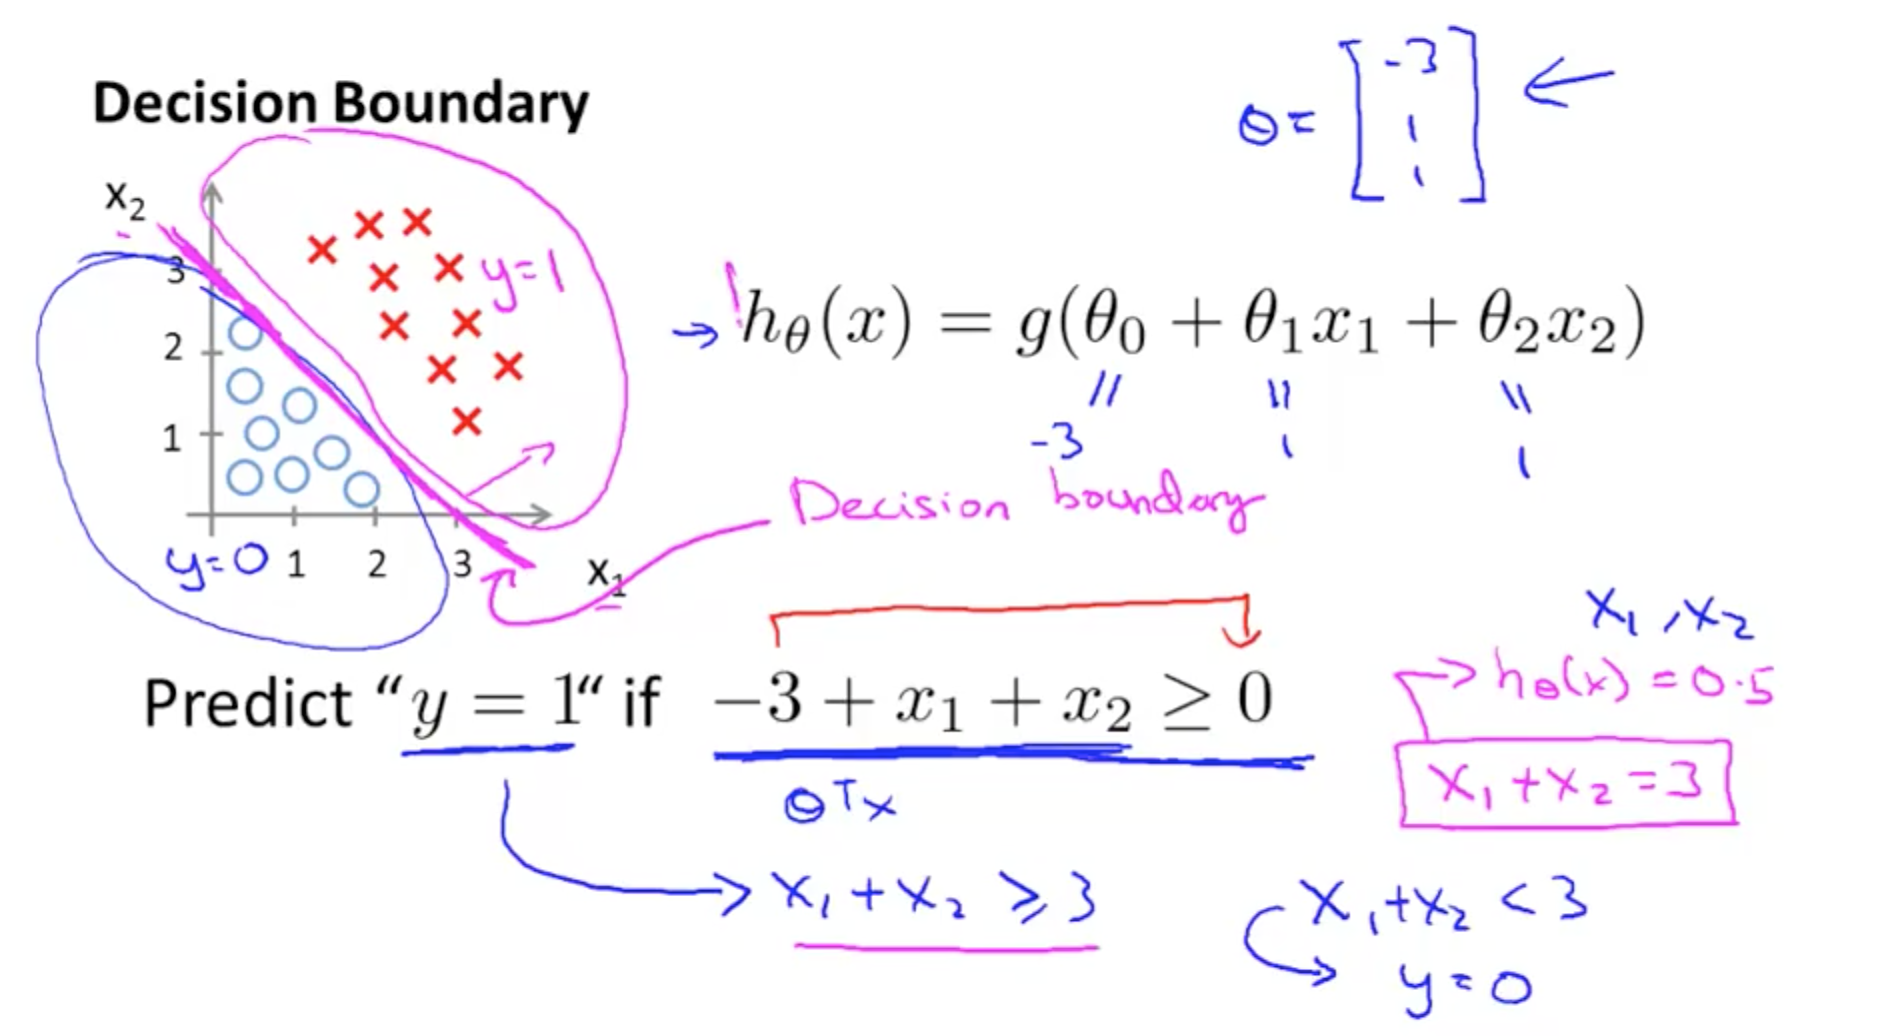
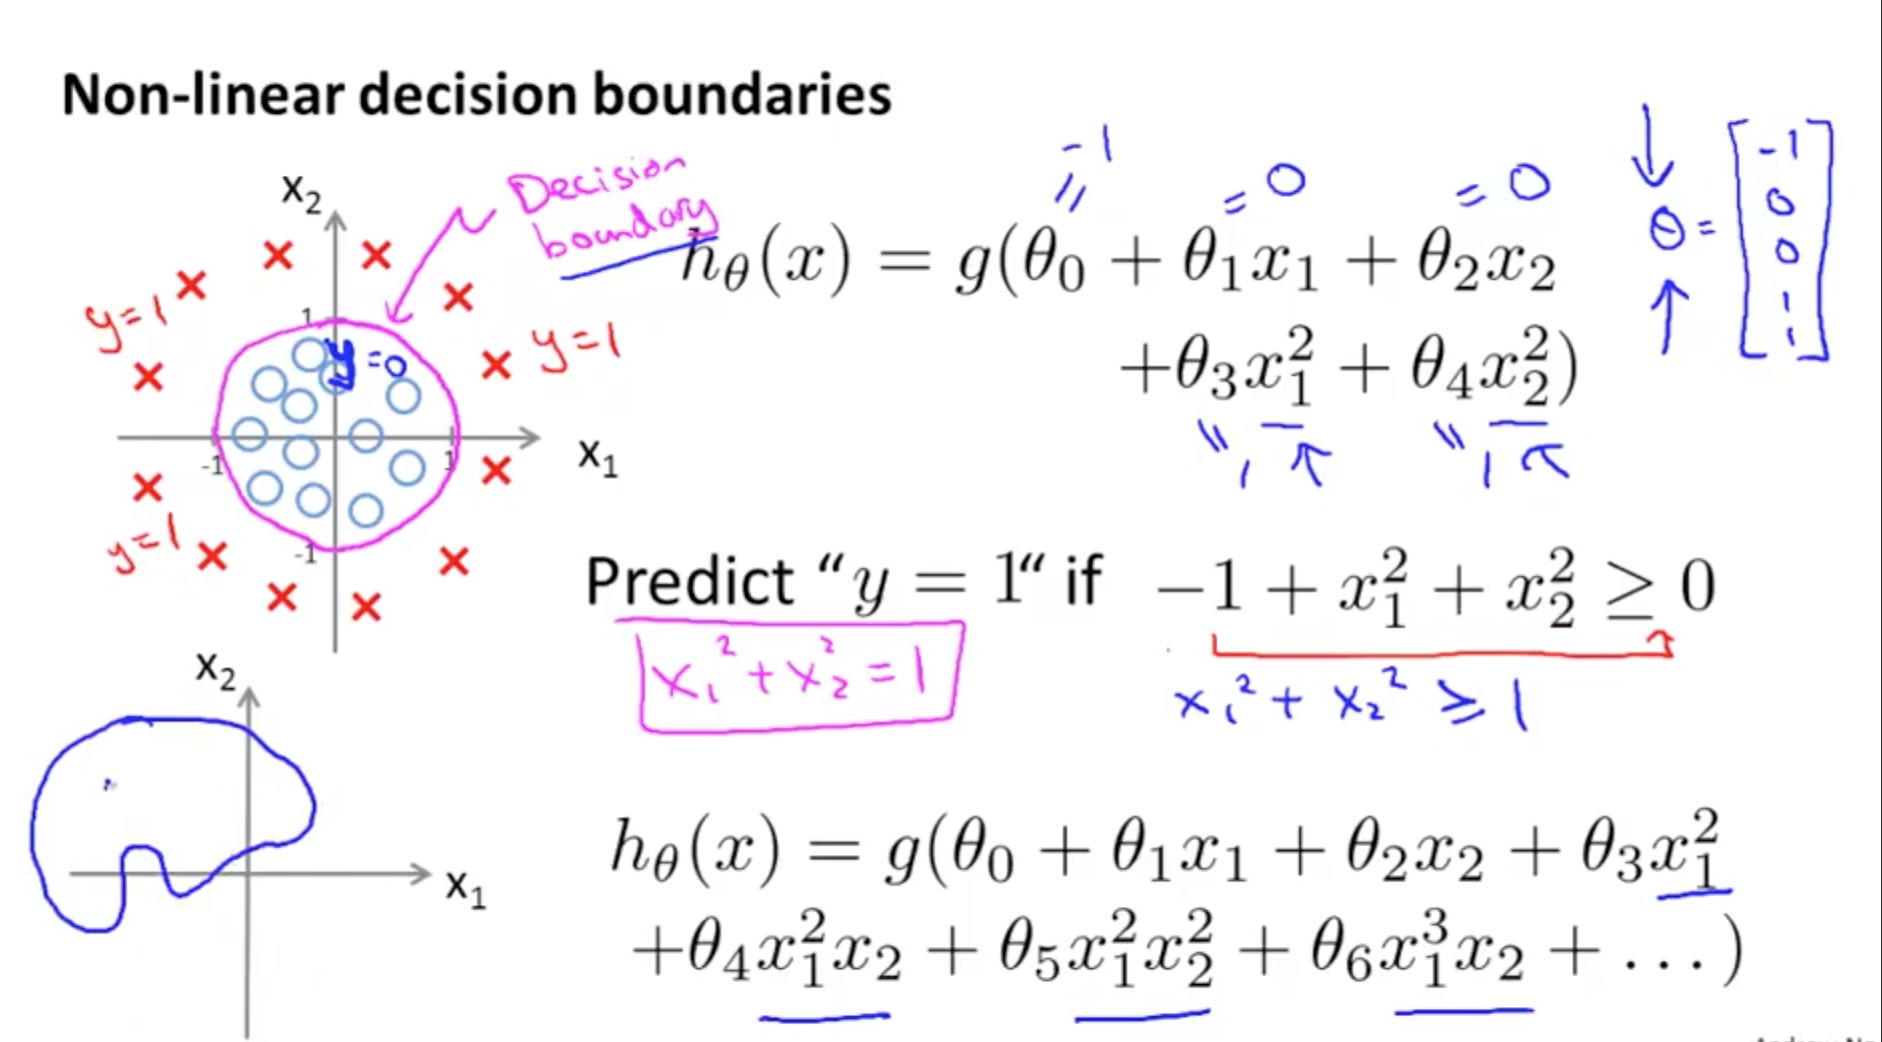
Further we shall discuss on the Logistic Regression Model.
https://www.youtube.com/watch?v=-la3q9d7AKQ
https://www.youtube.com/watch?v=t1IT5hZfS48
https://www.youtube.com/watch?v=F_VG4LNjZZw
https://www.youtube.com/watch?v=HIQlmHxI6-0
