This repository has been archived by the owner on Mar 2, 2021. It is now read-only.
Visualizing Strahler stream order
- Sample style file:
strahler.se. Appropriate for this specific example only!
In OrbisGIS, we can visualize the Strahler number by applying different colors and/or thicknesses to the edges. The edges in the test_hydro.strahler_edges layer resulting from the above script have Strahler numbers 1, 2, 3 and 4. Below, we increase line thickness with Strahler number, and we apply the following color scheme: 1=blue, 2=green, 3=pink, 4=red. Using the above style file, we obtain the following representation:

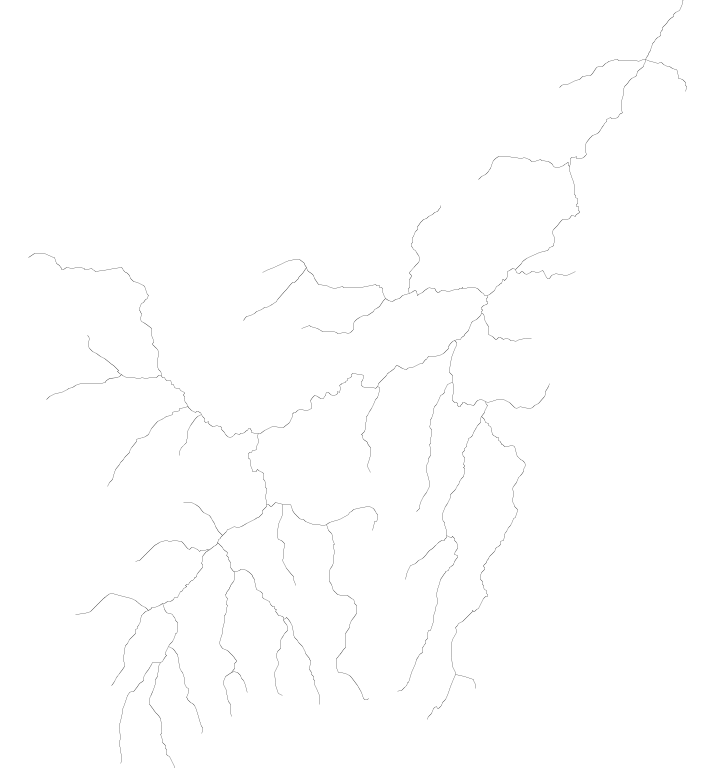
Here is the original network, represented in the test_hydro layer: