Quick Start
See https://github.com/naver/ngrinder/wiki/Installation-Guide
A user can get the nGrinder URL and log in with an id provided by your nGrinder administrator.
If it is the first access to nGrinder after installation, You can login with admin(id) / admin(password).
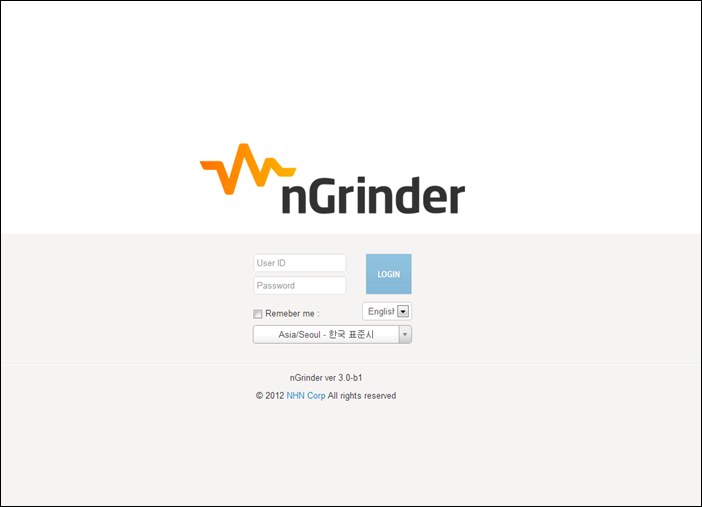
The login page have several functions.
- Remember me: user will be saved temporarily, if page is closed due to an error. User is logged in again automatically.
- Time zone: User can select local time zone so that the test data on the page is displayed correctly.
- Language:User can select a native language. Currently English, Korean and Chinese are supported.
Quick Start is a convenient way to create a test.
You can simply input Test URL, and a test script will be generated automatically.
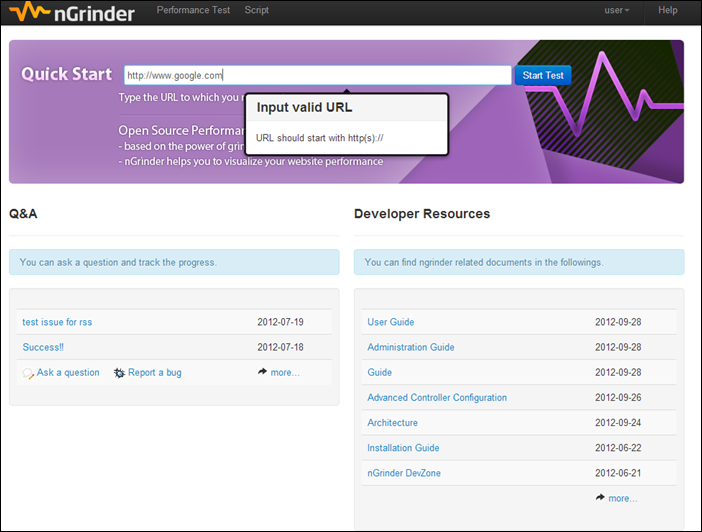
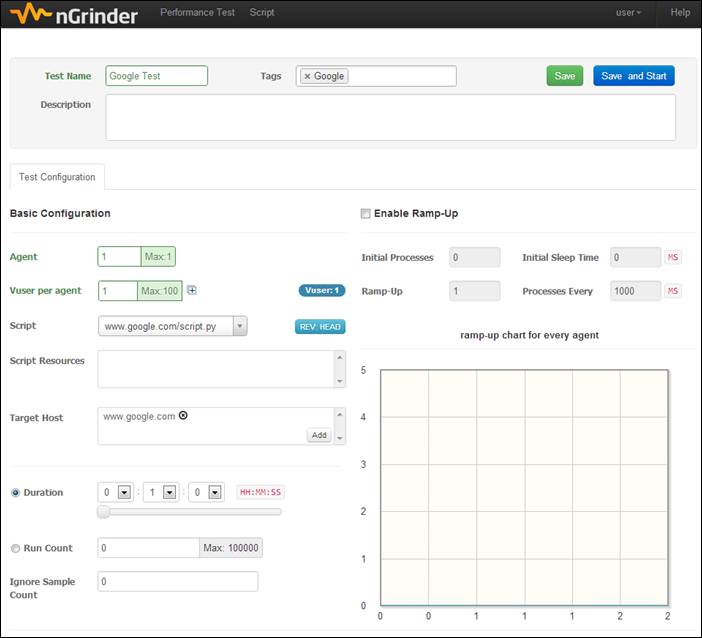
Then, you can see the test configuration page.

You can specify how many agents will be assigned and how many vusers will be used per agent will be used. Vuser is a concept related to how many load threads are used.
Then, you can set how long the test will be performed in the Duration or RunCount field.
If you click the REV:HEAD button above, You can see what script is being used for the test.
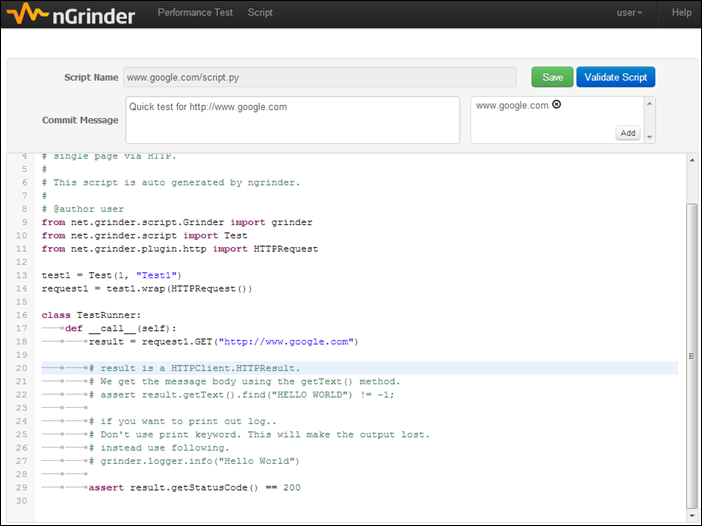
The generated Jython script simply calls the given url and checks that the status code is 200. You can modify the script as you wish.
Go back to the Test Configuration page, specify the test as above and Click the Save and Start button. Then you can see the following dialog box.

You can schedule this test or just run the test now. Click the Run Now button.
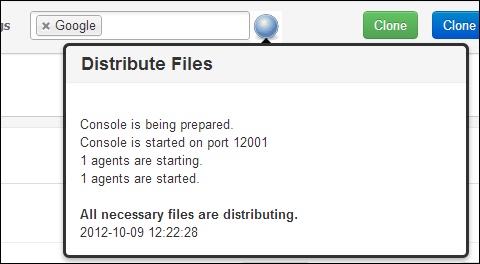
The test will be listed on the test list. After a while(about 5 seconds), You should see the blinking ball. If you hover the mouse over the ball, you can see the progress message

If you want to see the current status of a test, just hover the mouse over the ball. A popup window will appear and showing the test progress message.
It will take some time until the test is actually performed, as each test needs to distribute scripts and resources.
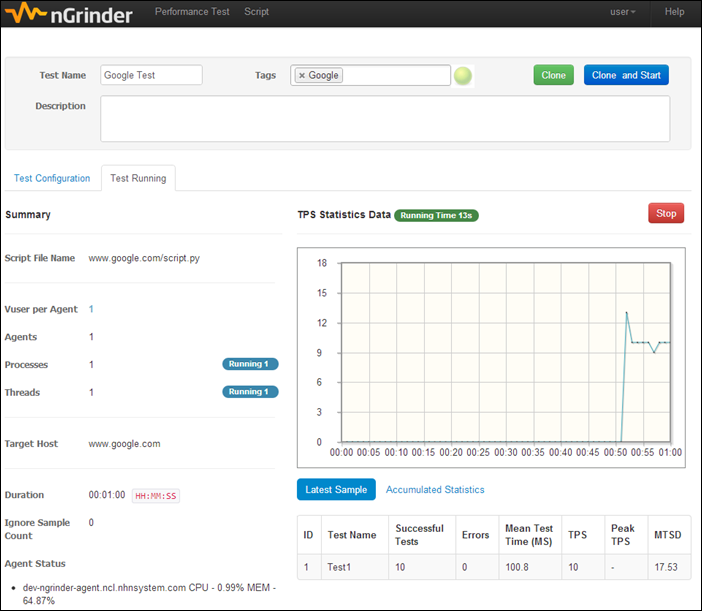
When the test is actually started, the tab above will be activated. This shows the current TPS.
After a while, the test is stopped. At this point, the following page will be shown.
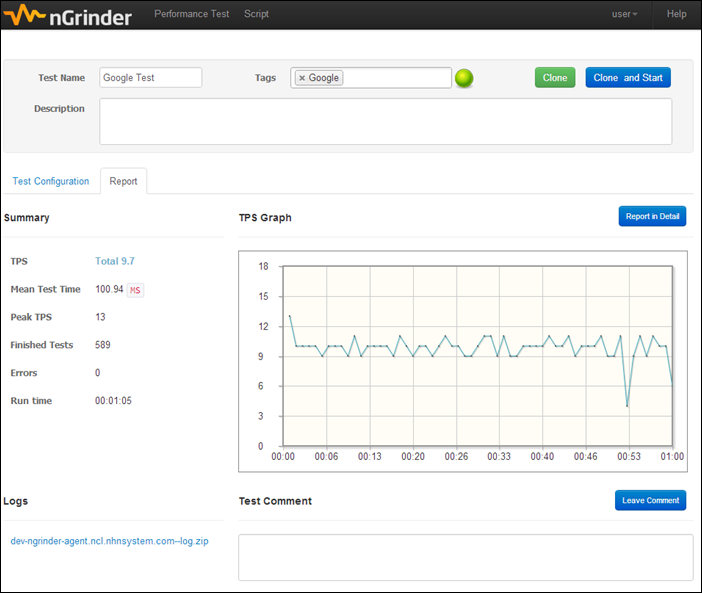
You can see the whole TPS trends in the above chart. If needed, you can leave a comment on this result as well.
If you click Report in Detail, you can see a more detailed report in a popup window.

This shows the TPS, Mean Test Time and Errors graph for the given test duration.
If you have installed a monitor on the target, you can see the performance report by clicking the target host links at the bottom-left.
That’s all you need to know to get started!