A software to analyze and visualize data generated by D.I.S.H.A
- Clone D.I.S.H.A
- Setup and install D.I.S.H.A.
- Clone D.I.S.H.A-viewer
cd ./D.I.S.H.A-viewerconda activate dishapython -m buildpip install ./dist/<.whl file name>- Run
disha-viewerto launch ui
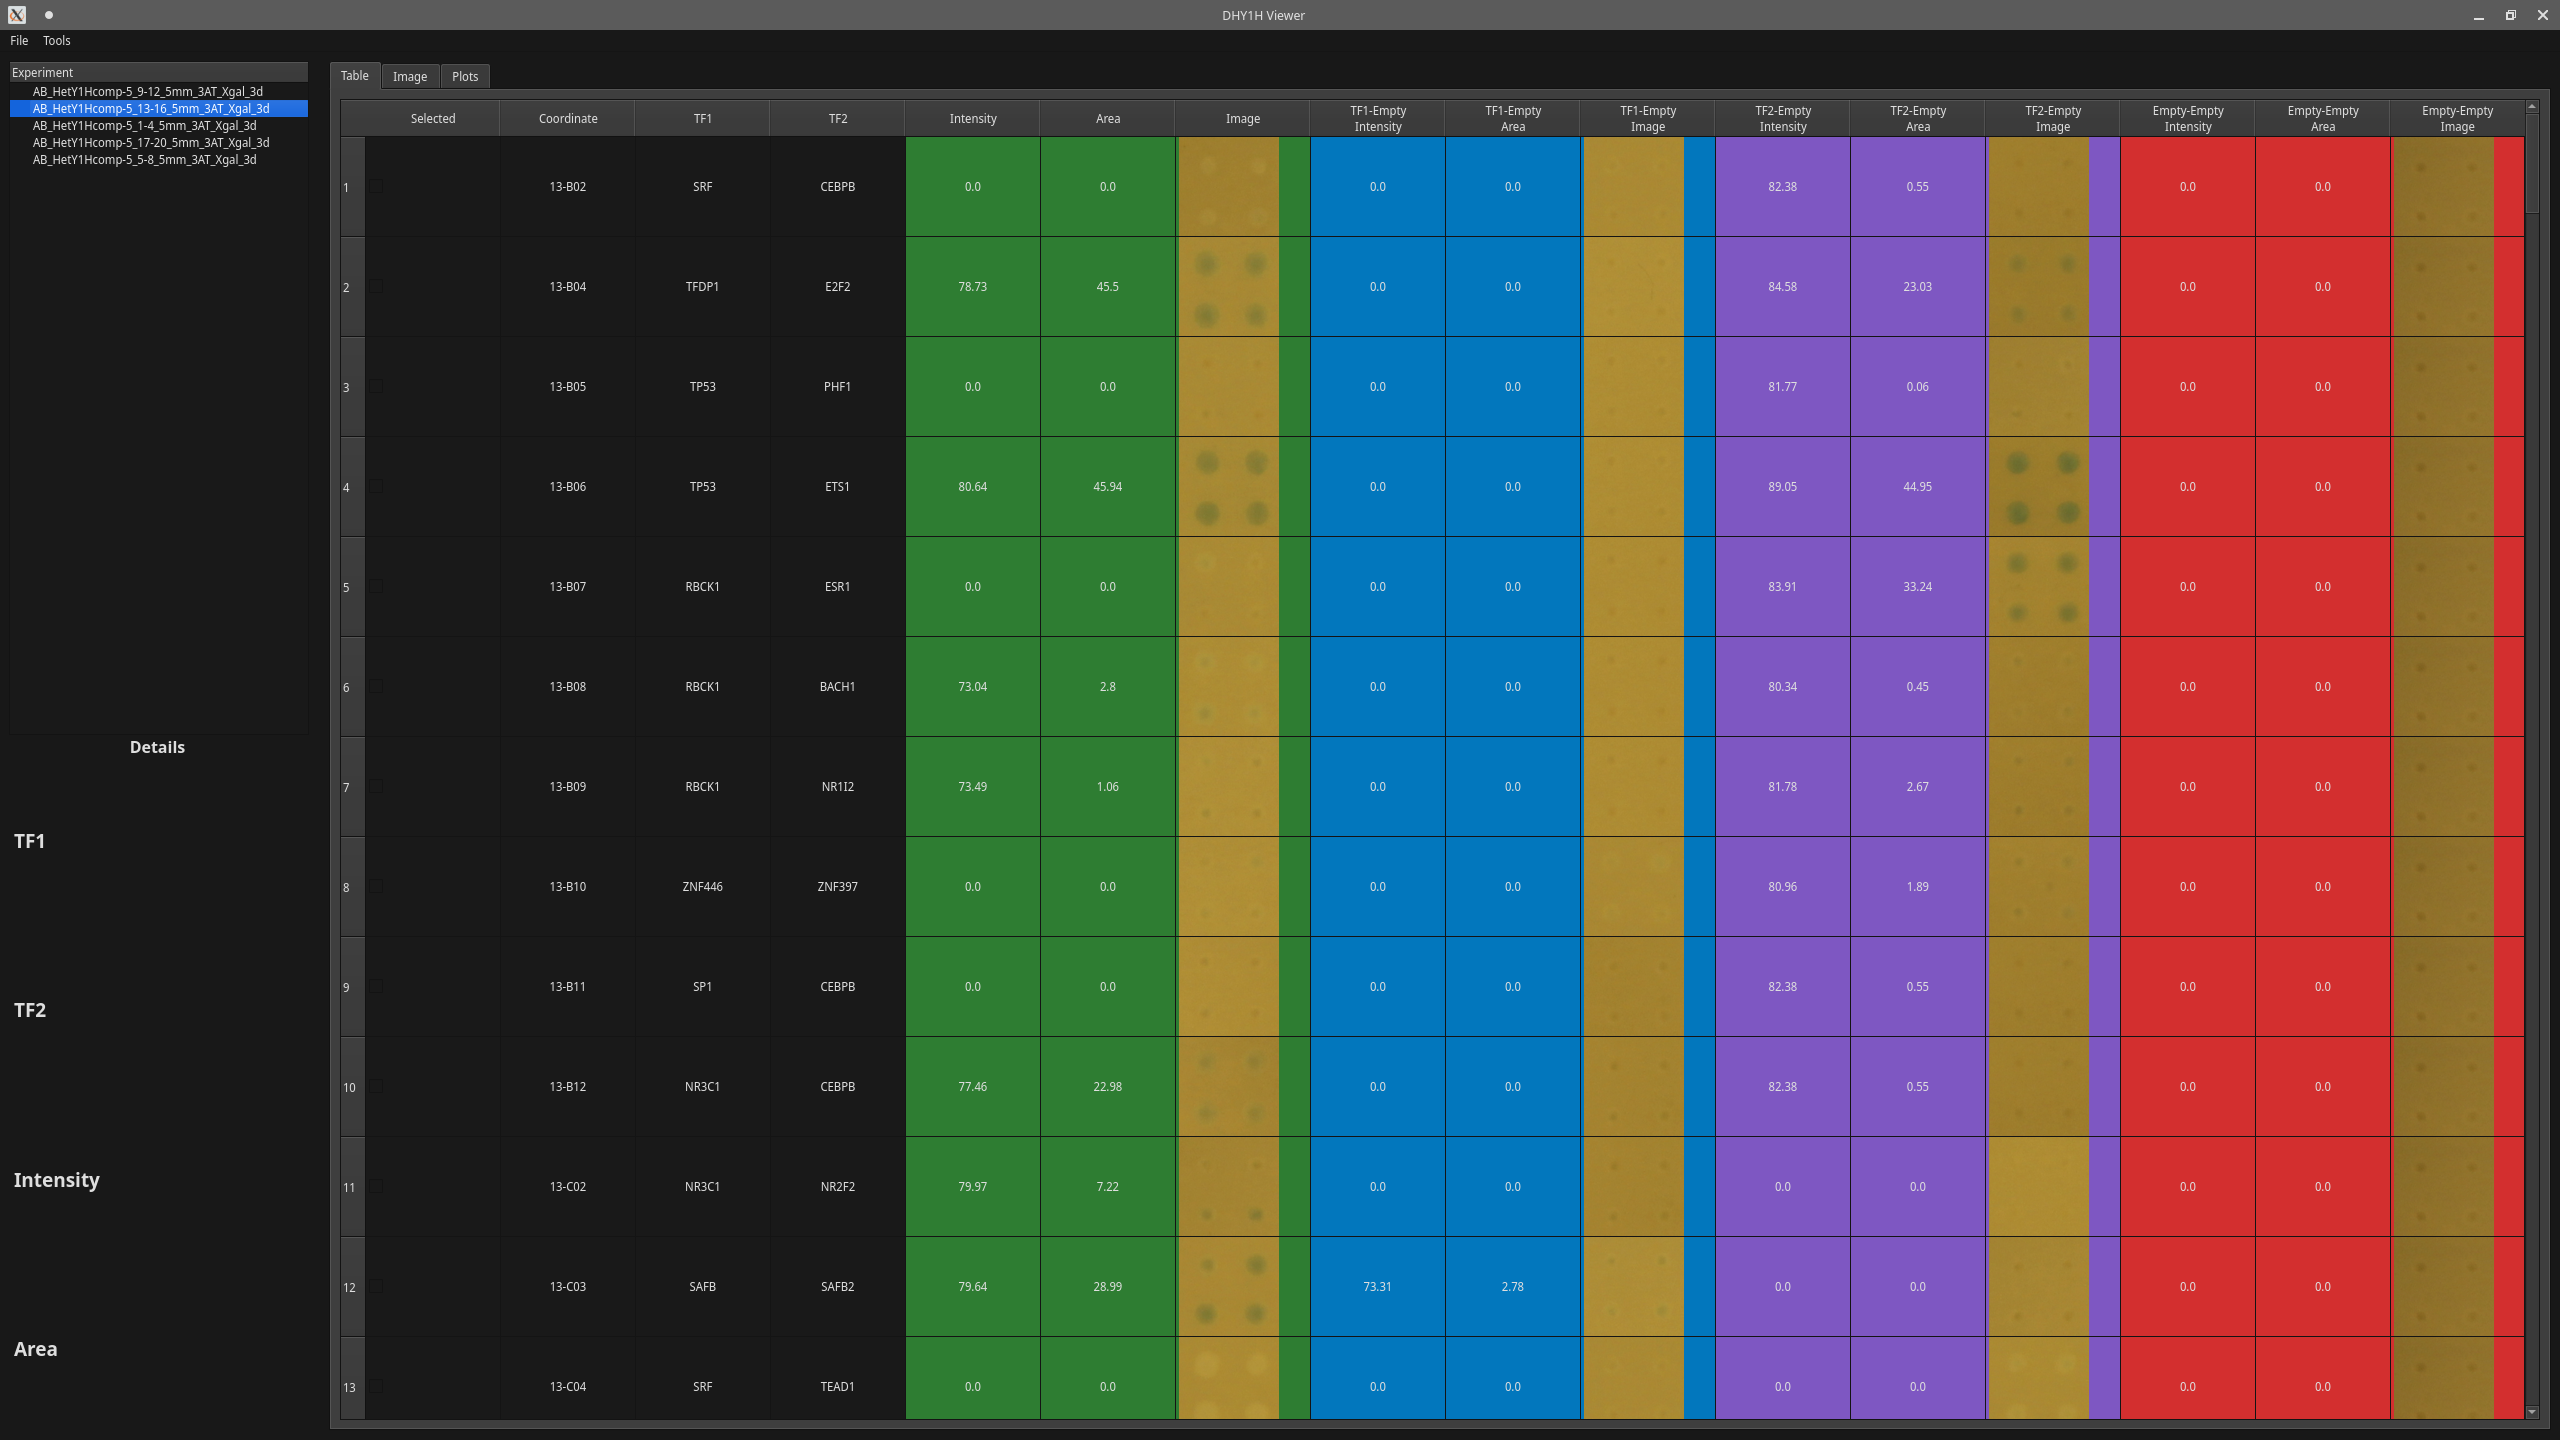
- Compare impacts of different transcriptional factors quantitatively based on the area and intensity of the quads.
- Automatically, organize experiments based on bait-number.
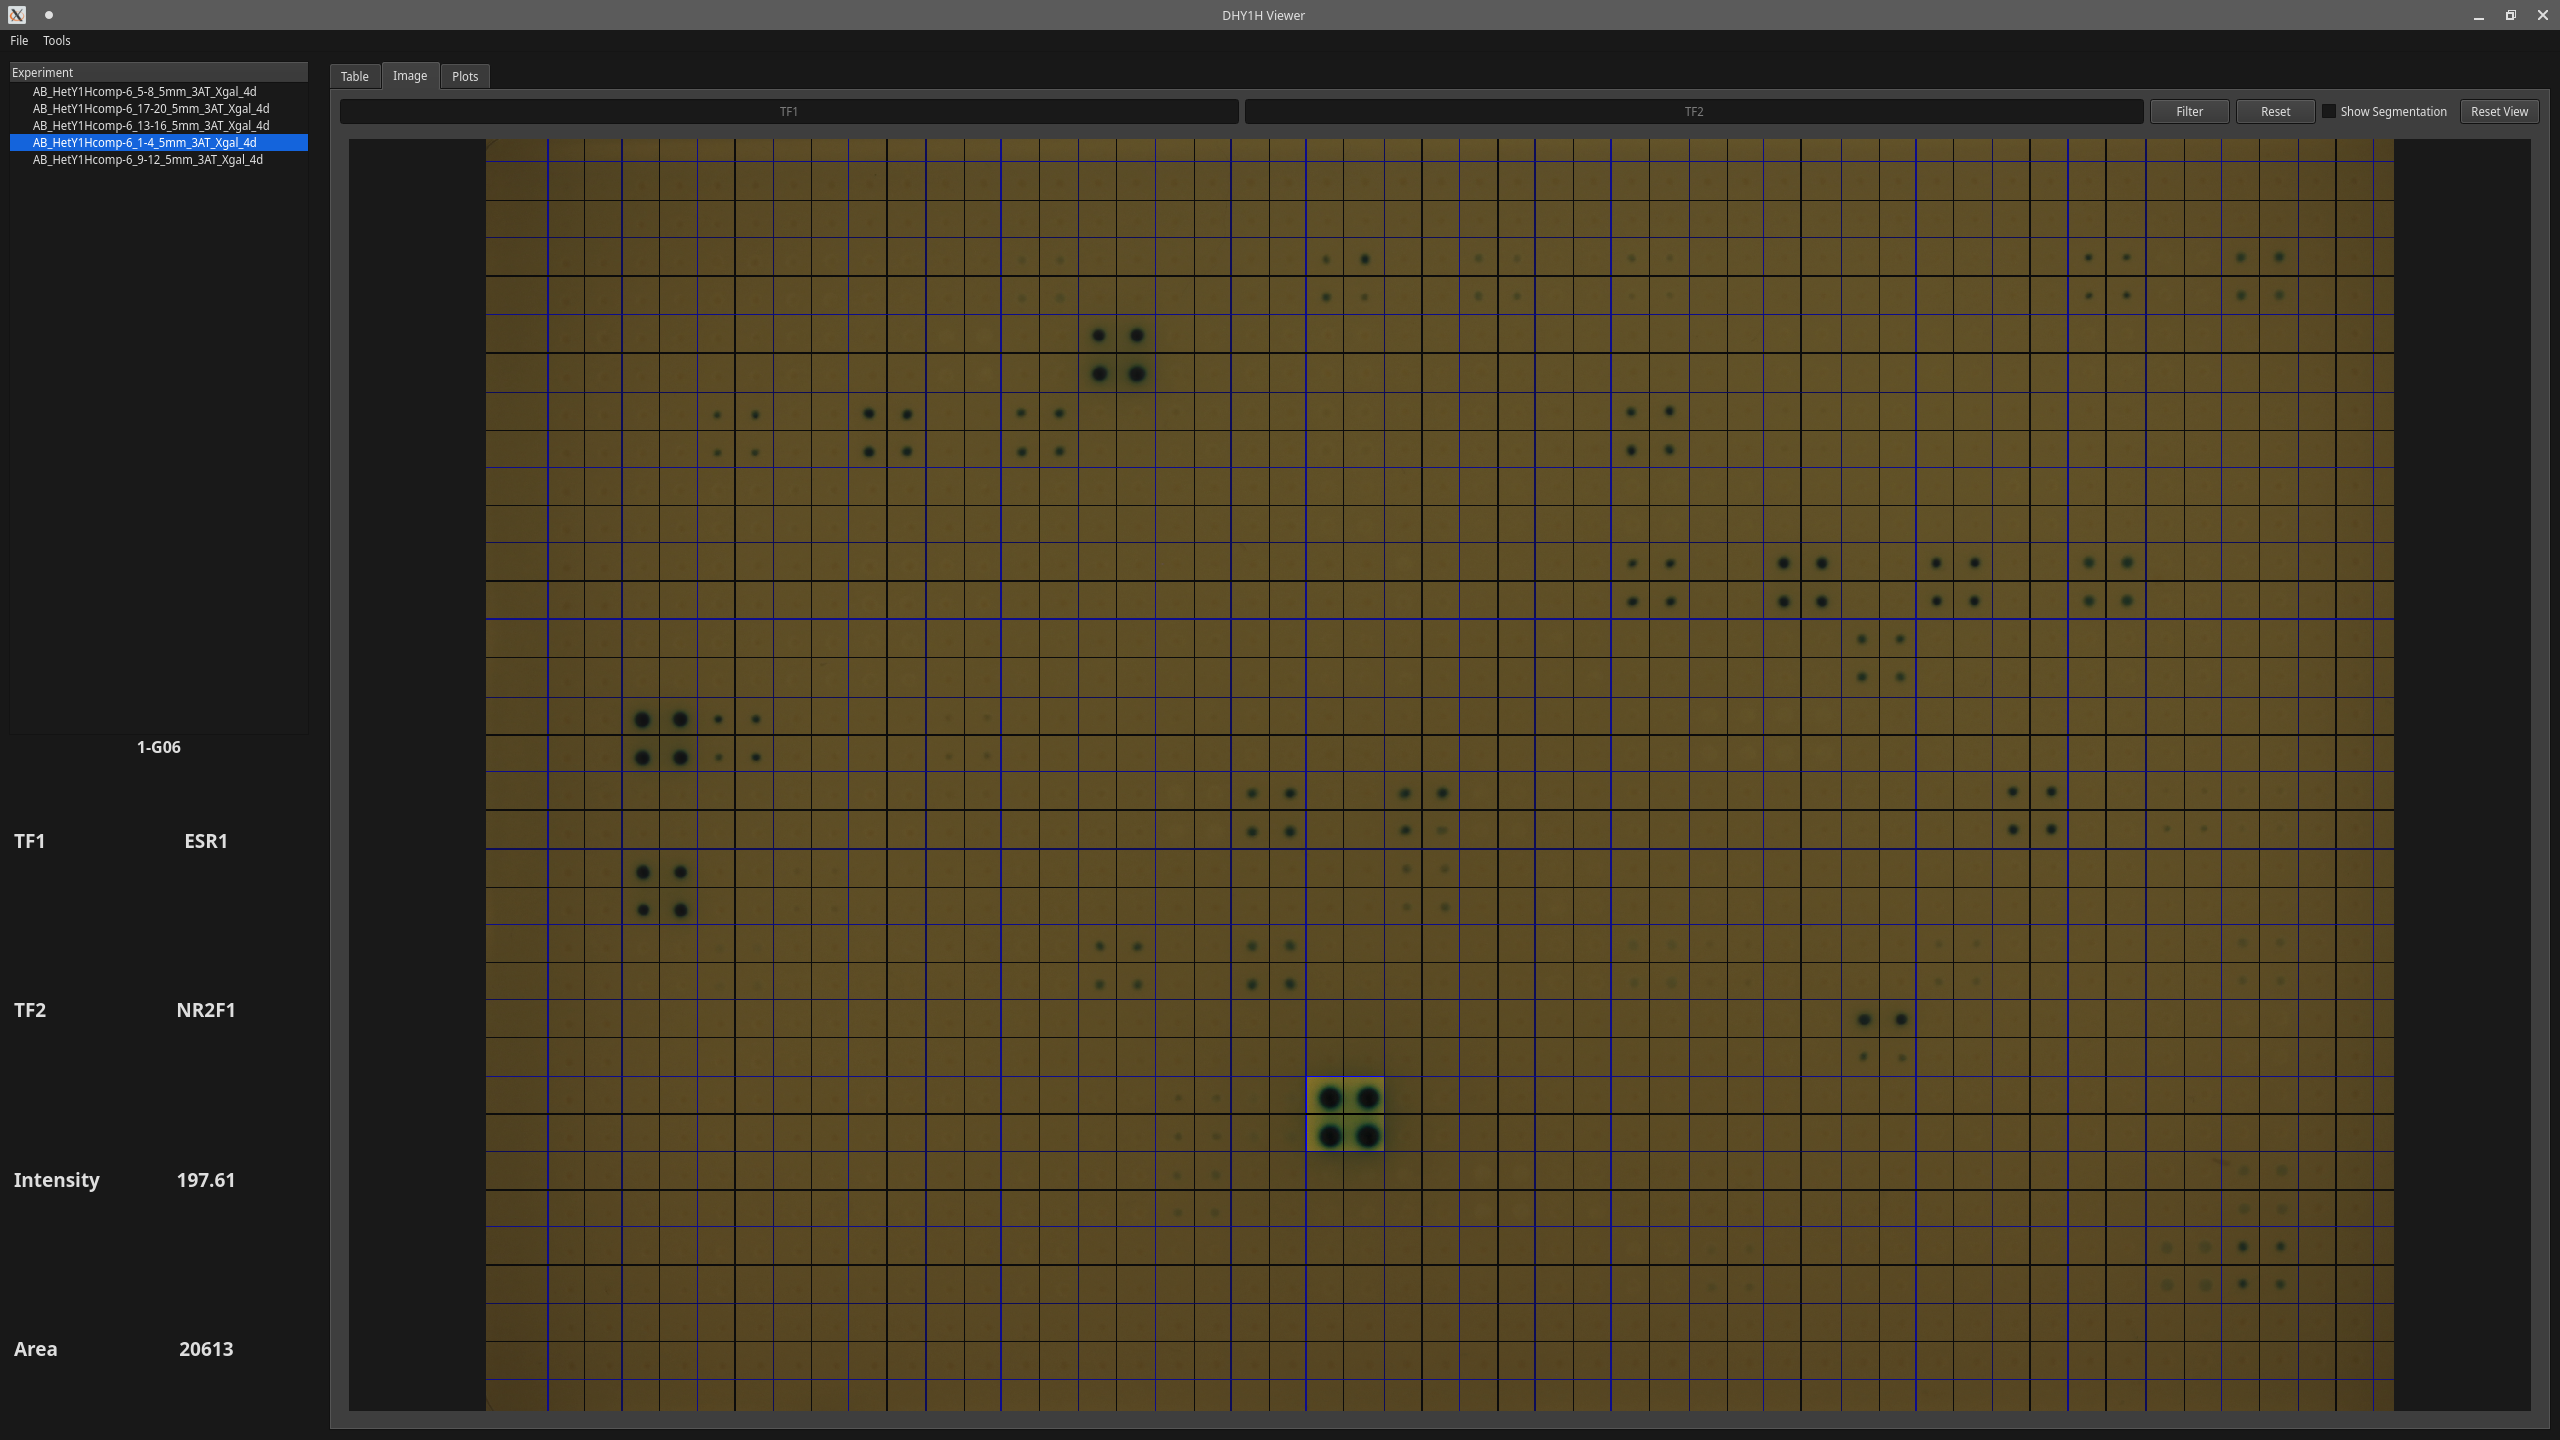
- Click on the quads on the image and look at their information.
- Visualize segmented yeast colonies.
- Generate heat-maps for intensity and area for all transcription factor pairs.
- Normalize data and regenrate tables.
- Save selected colonies for future reference.

