This solution is based on the solution of Dave Glover
The goal of this project is to measure the temperature and humidity in every room of my house and to analyse the data over time in relation to the intended temperature of the house. The expected results are:
- Rooms where the temperature drops faster than average when the heater turns of -> isolation should be improved
- Rooms where the temperature rises slower than average -> radiator configuation or placement could be improved
The ESP8266 is a great commodity priced Arduino compatible MCU with integrated WiFi
This project is implemented and tested on the following ESP8266 based development boards:
Arduino core for ESP8266 WiFi chip V2.3.0 firmware adds HTTPS (TLS 1.0 and 1.1) support, making this a viable platform for secure IoT data streaming. See Security Discussion for more information.
This sample verifies your IoT Hub Server Certificate to mitigate against Man in the Middle Attacks.
The Server Certificate Fingerprint was generated as follows:-
- From Bash on Ubuntu on Windows (10) or Linux
- echo -n | openssl s_client -connect IoTCampAU.azure-devices.net:443 | sed -ne '/-BEGIN CERTIFICATE-/,/-END CERTIFICATE-/p' > cert.pem
- openssl x509 -noout -in cert.pem -fingerprint
- See Certificate Pinning article for more information
IoT Hub is designed to "Securely connect, monitor, and control millions of IoT assets" and is designed for internet scale data ingestion.
Stream Analytics, Power Bi and preconfigured IoT Hub solutions such as Remote monitoring provide ways to visualise and unlock the value of your data in Azure.
For more background information read this "Stream Analytics & Power BI: A real-time analytics dashboard for streaming data" article.
- Setup your Azure IoT Hub. There is a free 8000 message a day subscription to get started.
- Register your device with Azure IoT Hub.
- Update the main AzureClient.ino sketch
- Deploy the solution to your ESP8266 based device.
- View data with Device Explorer
- Optionally: Visualise your data in real time with Azure Stream Analytics and Power BI.
Follow lab Setting Up Azure IoT to provision an Azure IoT Hub and an IoT Hub device.
Open the Config.h file in the solution and configure the following:
#define WIFI_SSID "[Your WiFi SSID]"
#define WIFI_PWD "[Your WiFi Password]"

#define NTP_SERVER "[Your prefered time server, 'pool.ntp.org' chooses a default, 'nl.pool.ntp.org' gives a server in the Netherlands]"

#define DEVICE_LOCATION "[Your device location - eg Garage]"

#define DEEP_SLEEP_IN_SECONDS 0
#define PUBLISH_RATE_IN_SECONDS 60

#define IOTHUB_CONNECTION_STRING "[Your IoT Hub/Central Connection String eg HostName=saas-iothub-897898-f33a-4002-a44a-7ca5961b00b6.azure-devices.net;DeviceId=wemos-garage;SharedAccessKey=uRsr78d56s87878dd89d675g88H8+nRoiVgc3+epqlMHHg="The sample includes the following sensors in the main project: Fake Sensor, BME280, and the Sht30. The default sensor returns fake temperature, humidity, pressure and light telemetry. To switch to a real sensor comment out the Sensor sensor line and uncomment one of real sensors.
#define BME280
// or
#define Sht30
There are additional drivers in the drivers directory: BMP180, BMP280, DHT11, DHT22, LDR, OLED.
From Device Explorer, head to the Data tab, select your device, enable consumer group then click Monitor.
Azure Stream Analytics enables you to gain real-time insights in to your device, sensor, infrastructure, and application data.
See the Visualizing IoT Data lab. Replace the query in that lab with the following and be sure to change the time zone to your local time zone offset. Australia (AEDST) is currently +11 hours.
SELECT
    iothub.connectiondeviceid deviceid,
    Geo AS GeoLocation,
    Max(DateAdd(Hour, 10, EventEnqueuedUtcTime)) AS TimeCreated, -- AU EST UTC + 10
    Avg(Celsius) AS Temperature,
    AVG(Humidity) AS Humidity,
    AVG(Light) AS Light,
    AVG(HPa) AS AirPressure
INTO
    [PowerBI]
FROM
    [TelemetryHUB] TIMESTAMP BY EventEnqueuedUtcTime
GROUP BY
    iothub.connectiondeviceid, Geo,
    TumblingWindow(minute, 30)
Microsoft Power BI makes it easy to visualise, organize and better understand your data.
Follow the notes in the See the Visualizing IoT Data lab and modify the real time report as per this image.
View on the web or with the Power BI apps available on iOS, Android and Windows.
The AzureClient sketch streams data in the following JSON format, of course you can change this:)
{"Utc":"2017-01-12T08:00:38","Celsius":25.00,"Humidity":50.00,"hPa":1000,"Light":0,"Geo":"sydney","Schema":1,"Mem":21368,"Id":2}
There are a number of ESP8266 based development boards available so be sure to check out this great article "Comparison of ESP8266 NodeMCU development boards".
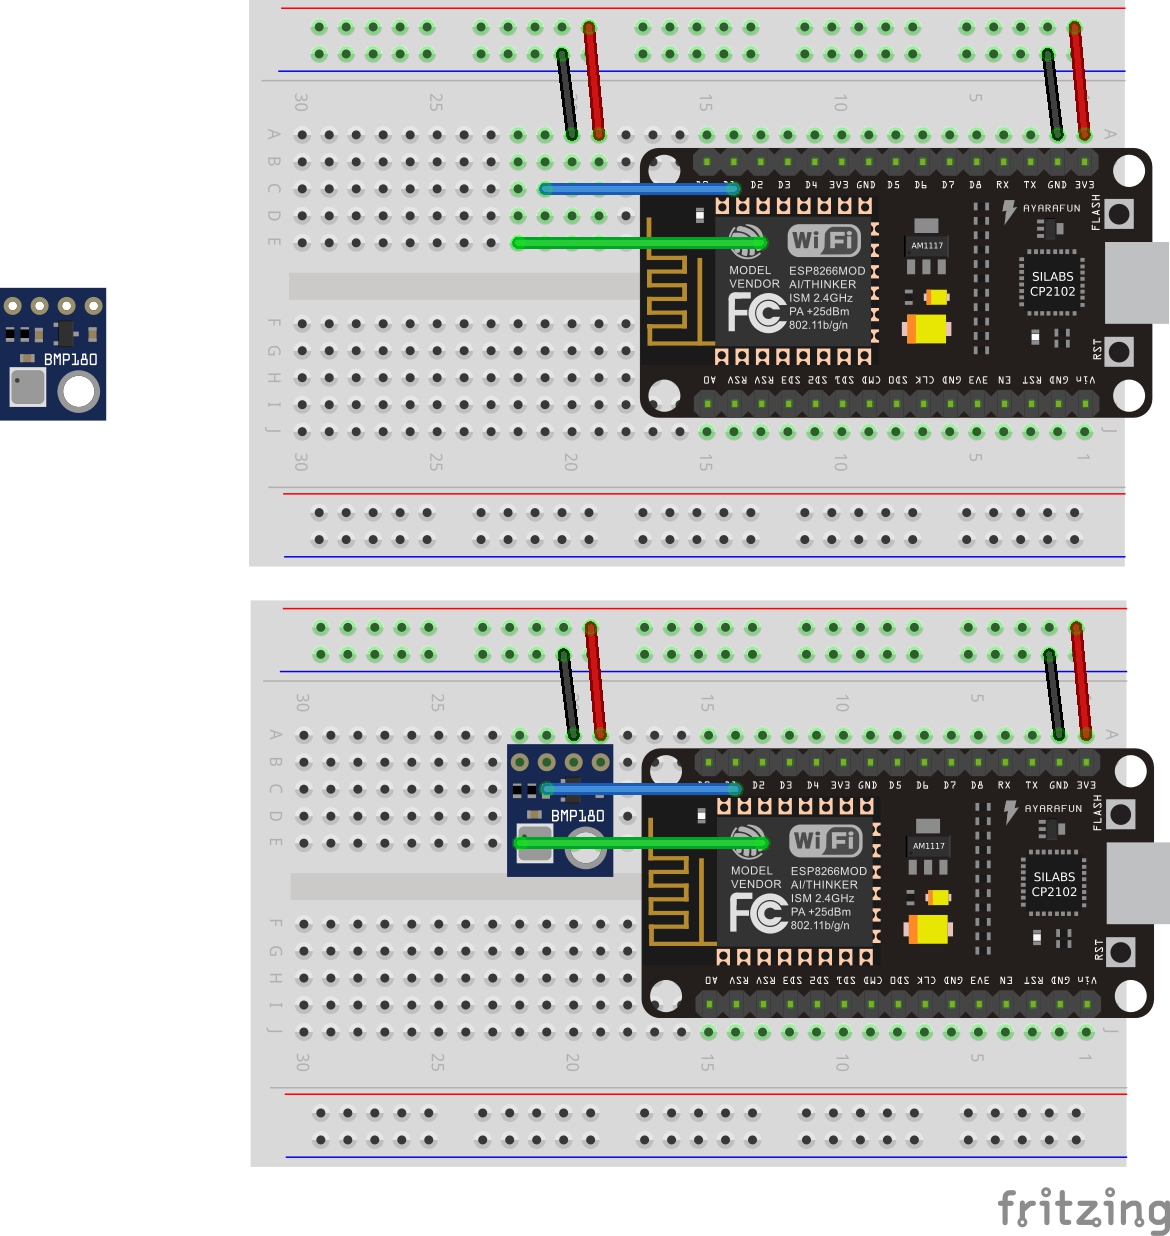
- NodeMCU v2
- BMP180 Barometric Pressure Sensor
- 1 x 400 Tie Point Interlocking Solderless Breadboard
- Wires
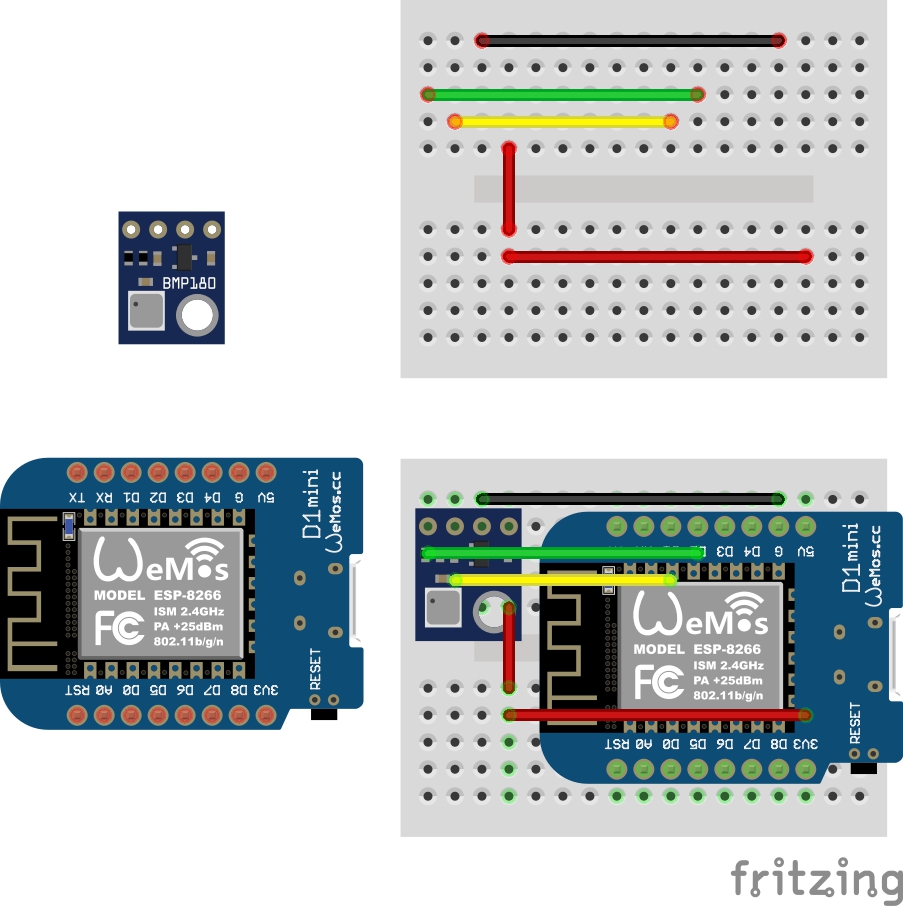
- WeMos D1 Mini
- BMP180 Barometric Pressure Sensor
- 1 x Mini Breadboard
- Wires
- WeMos D1 Mini
- BME280 Barometric Pressure Sensor
- 1 x Breadboard, Protoboard or PCB
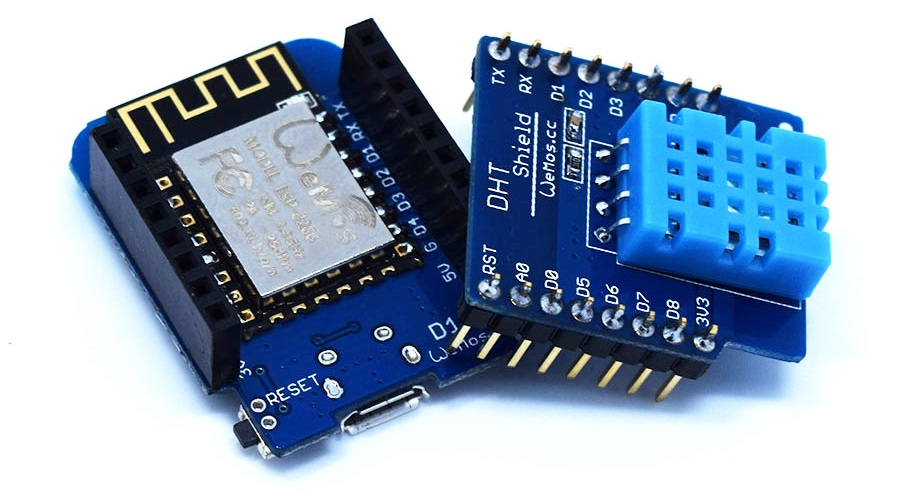
No wiring required, just solder the supplied header pins for the WeMos and the DHT Sensor shield.
- WeMos D1 Mini
- DHT Shield or the DHT Pro Shield.
- NodeMCU - On Windows, Mac and Linux you will need to install the latest CP210x USB to UART Bridge VCP Drivers.
- WeMos - On Windows and Mac install the latest Ch340G drivers. No drivers required for Linux.
- ESP8266 Thing Development Board Hookup Guide
As at November Jan 2018 use:-
- Arduino IDE 1.8.7.
- ESP8266 Board Manager 2.3.0 for HTTPS/TLS Secure Client support.
Arduino version 1.6.4 and above allows installation of third-party platform packages using Boards Manager.
- Install Arduino 1.8.7 from the Arduino website.
- Start Arduino and open Preferences window.
- Enter http://arduino.esp8266.com/stable/package_esp8266com_index.json into Additional Board Manager URLs field. You can add multiple URLs, separating them with commas.
- Open Boards Manager from Tools > Board menu and install esp8266 platform (and don't forget to select your ESP8266 board from Tools > Board menu after installation).
- Select NodeMCU or WeMos D1 Mini Board: Tools -> Board -> NodeMCU 1.0 (ESP-12E module) or WeMos D1 Mini
- Set Port and Upload Speed: Tools. Note, you may need to try different port speeds to successfully flash the device. Faster is better as each time you upload the code to your device you are re-flashing the complete ROM not just your code.
Be sure to read the ESP8266 Arduino Core Documentation - there are some minor gotchas.


