A very naive implementaion to provide pseudo 3-d projection look to your 2d matplotlib figure.:

It supports an arbitrary bezier curve by linearizing it.:

The documentation is far from complete. Your best friends are included examples. Please check the gallery in the readthedocs site.
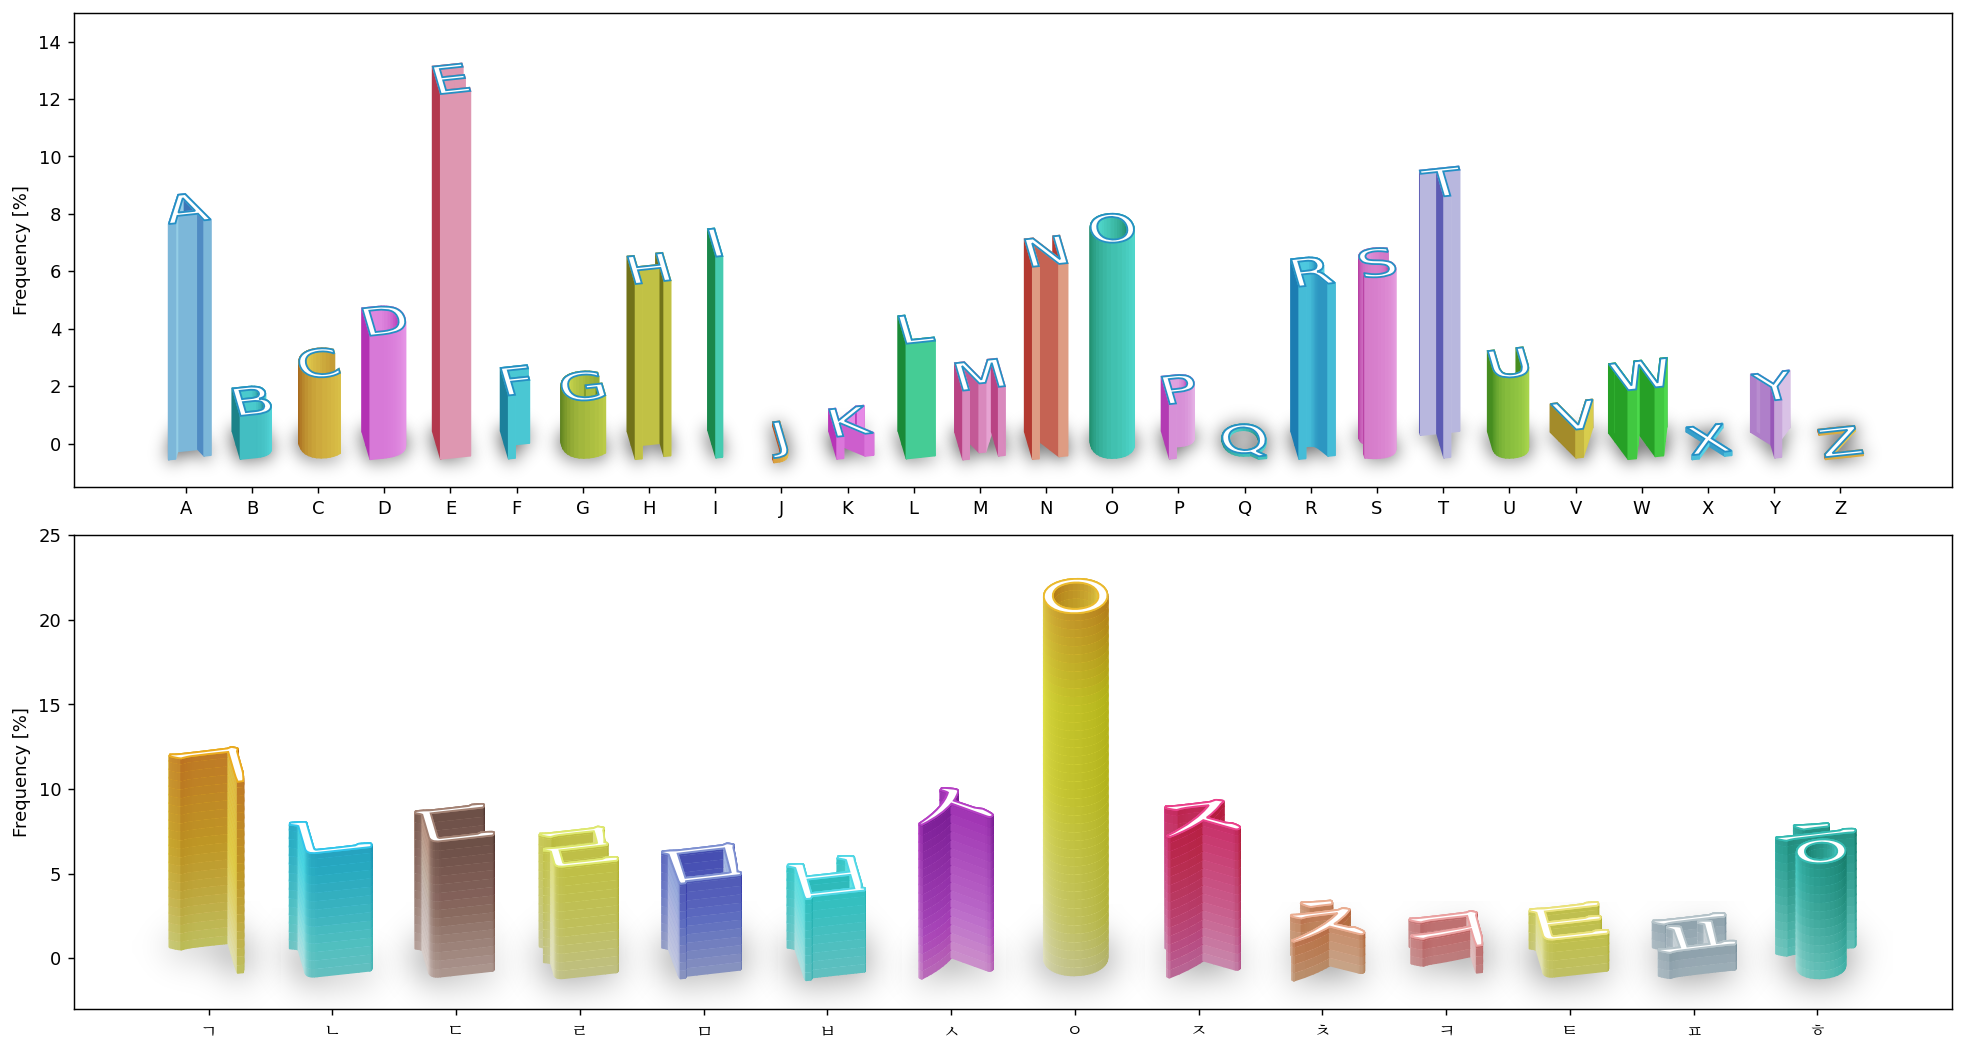
Also, take a look at my tutorial of creating alphabet frequency chart.
pip install mpl-poormans-3d