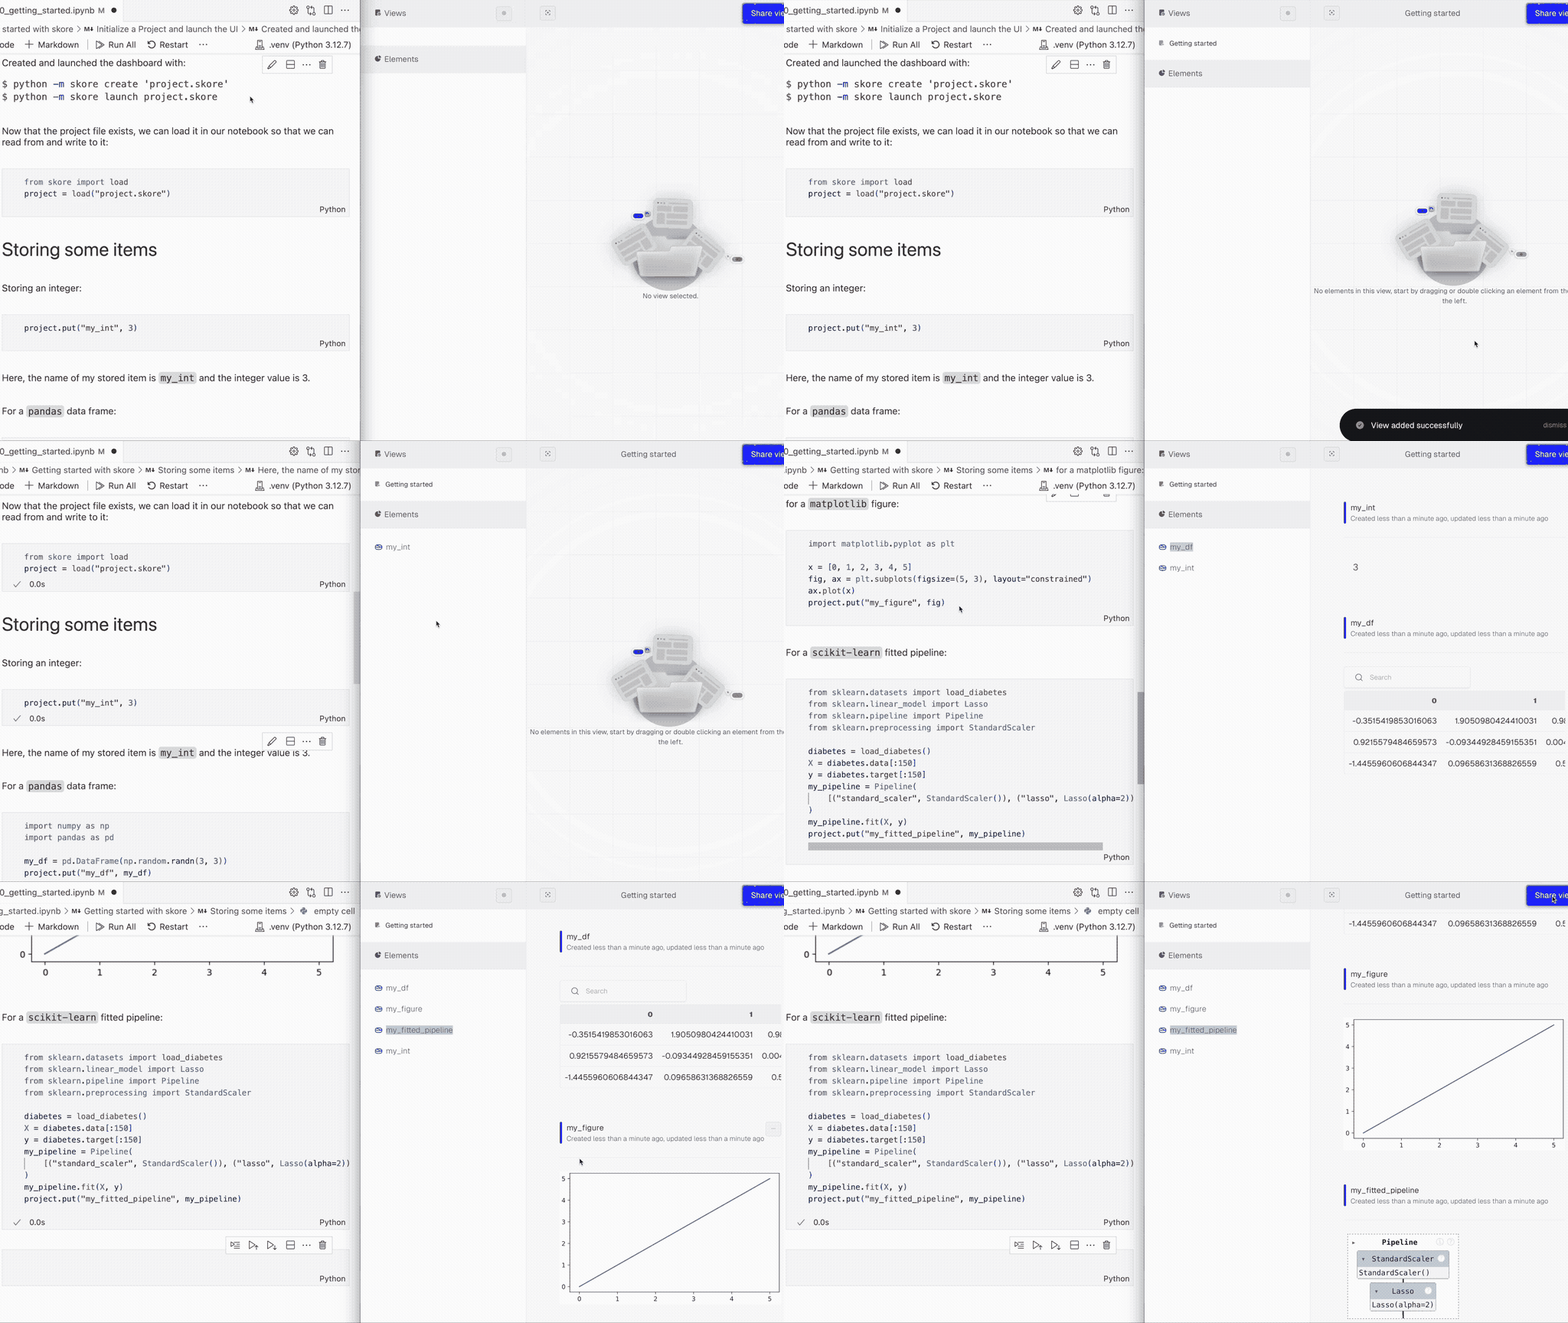
With skore, data scientists can:
- Track and visualize their ML/DS results.
- Get assistance when developing their ML/DS projects.
- Scikit-learn compatible
cross_validate()provides insights and checks on cross-validation.
- Scikit-learn compatible
These are only the first features: skore is a work in progress and aims to be an end-to-end library for data scientists.
Stay tuned, and join our Discord if you want to give us feedback!
First of all, we recommend using a virtual environment (venv). You need python>=3.9.
Then, you can install skore by using pip:
pip install -U skoreWarning: For Windows users, the encoding must be set to UTF-8: see PYTHONUTF8.
- From your shell, initialize a skore project, here named
my_project:
python -m skore create "my_project"This will create a skore project directory named my_project.skore in your current working directory.
- Now that the project file exists, from your Python code (in the same directory), load the project so that you can read from and write to it, for example you can store an integer:
from skore import load
project = load("my_project.skore")
project.put("my_int", 3)- Finally, from your shell (in the same directory), start the UI locally:
python -m skore launch "my_project"This will automatically open a browser at the UI's location:
- On the top left, by default, you can observe that you are in a View called
default. You can rename this view or create another one. - From the Items section on the bottom left, you can add stored items to this view, either by clicking on
+or by doing drag-and-drop.
Note that after launching the dashboard, you can keep modifying the current items or store new ones from your python code, and the dashboard will automatically be refreshed.
Storing a pandas dataframe:
import numpy as np
import pandas as pd

my_df = pd.DataFrame(np.random.randn(3, 3))
project.put("my_df", my_df)
Storing a matplotlib figure:
import matplotlib.pyplot as plt

x = [0, 1, 2, 3, 4, 5]
fig, ax = plt.subplots(figsize=(5, 3), layout="constrained")
ax.plot(x)
project.put("my_figure", fig)
Storing a scikit-learn fitted pipeline:
from sklearn.datasets import load_diabetes
from sklearn.linear_model import Lasso
from sklearn.pipeline import Pipeline
from sklearn.preprocessing import StandardScaler

diabetes = load_diabetes()
X = diabetes.data[:150]
y = diabetes.target[:150]
my_pipeline = Pipeline(
    [("standard_scaler", StandardScaler()), ("lasso", Lasso(alpha=2))]
)
my_pipeline.fit(X, y)
project.put("my_fitted_pipeline", my_pipeline)
For more examples, see our documentation.
Thank you for your interest! See CONTRIBUTING.md.
| Type | Platforms |
|---|---|
| 🐛 Bug reports | GitHub Issue Tracker |
| ✨ Feature requests and ideas | GitHub Issue Tracker & Discord |
| 💬 Usage questions, discussions, contributions, etc | Discord |
Brought to you by


