IDIA Performance Benchmark
This project addresses multiple issue relating to testing and benchmarking of the pipeline system. The primary goal is to develop a tool that serves as a standard benchmark representative of the performance of most pipeline tasks. This tool would be comprised of a standard data set, a pipeline task, and an environment profile detailing the hardware, operating system and any virtual environment typically used to execute pipeline tasks. Initially we want to use simulated data so that we have complete understanding of the input data we use for testing, and so that we can scale the dataset in a natural way. Eventually we may need to add tests consisting of “real” experimental data. The code we want to test consists of a radio astronomy analysis task of representative complexity.
The output of each test should consist of the following: A one-line summary in CSV format that describes the system being tested, including hardware configuration, software, and container environments used, as well as a set of metrics that measure system runtime performance. This data can also be stored in a document-database so that multiple tests can be used to construct higher-level tools such as dashboards.
In addition to metrics, a set of graphs or data sets for each test, profiling the i/o, memory, and cpu usage and other key metrics over the runtime of the test. A file describing the environment and configuration used to run the test with sufficient detail to reproduce the test at a later time.
Once we have a standardized test or set of tests, we can easily benchmark the performance of the system. There are a variety of use cases for a standard benchmark. As we implement or upgrade a new component in our technology stack, we run a benchmark test to evaluate the performance impact on the end user. We could also set up an automated test suite which runs on a periodic (daily, weekly, or monthly) basis to monitor degradation or changes in performance due to unforeseen reasons. It can also be used to define optimization criteria to choose parallelization schemes, or to provide evidence for other technical questions.
The development is split in to multiple stages. The plan is documented here, IDIA Benchmarking Plan.
The github repository is here: IDIA Benchmarking.
An example notebook showing the various uses and output is available in the github repository: Benchmarking Example Notebook
To run a basic test from within a notebook, one can pass a function to the benchmarking class. The code in the function will be run in a new process, which will be killed after the test is completed. For example, if you put a tclean call inside a function called run_sim_test, you can run the full battery of tests with the following code:
import benchmark
mybenchmark = benchmark.Benchmark()
res = mybenchmark.execute_function(run_sim_test)
To print the pre-defined visualisations to your environment, execute the following lines of code.
from bokeh.io import output_notebook
output_notebook()
res.visualize()
The code below limits the number of OMP threads.
import utils
omp = utils.OpenMPRuntime()
print "OMP max threads: {}".format( omp.omp_get_max_threads() )
omp.omp_set_num_threads(2)
- Process / thread control
Control the number of processes and threads that are used by parallelisation frameworks like OpenMP and MPI. The number of threads and CPU affinity can be controlled using a utility tool available in the
benchmarkframework calledomp. - Memory management Manage a set of child processes which can be started and stopped in order to measure memory accurately.
- Simulation
- CPU
- Memory
- IO / Disk Speed
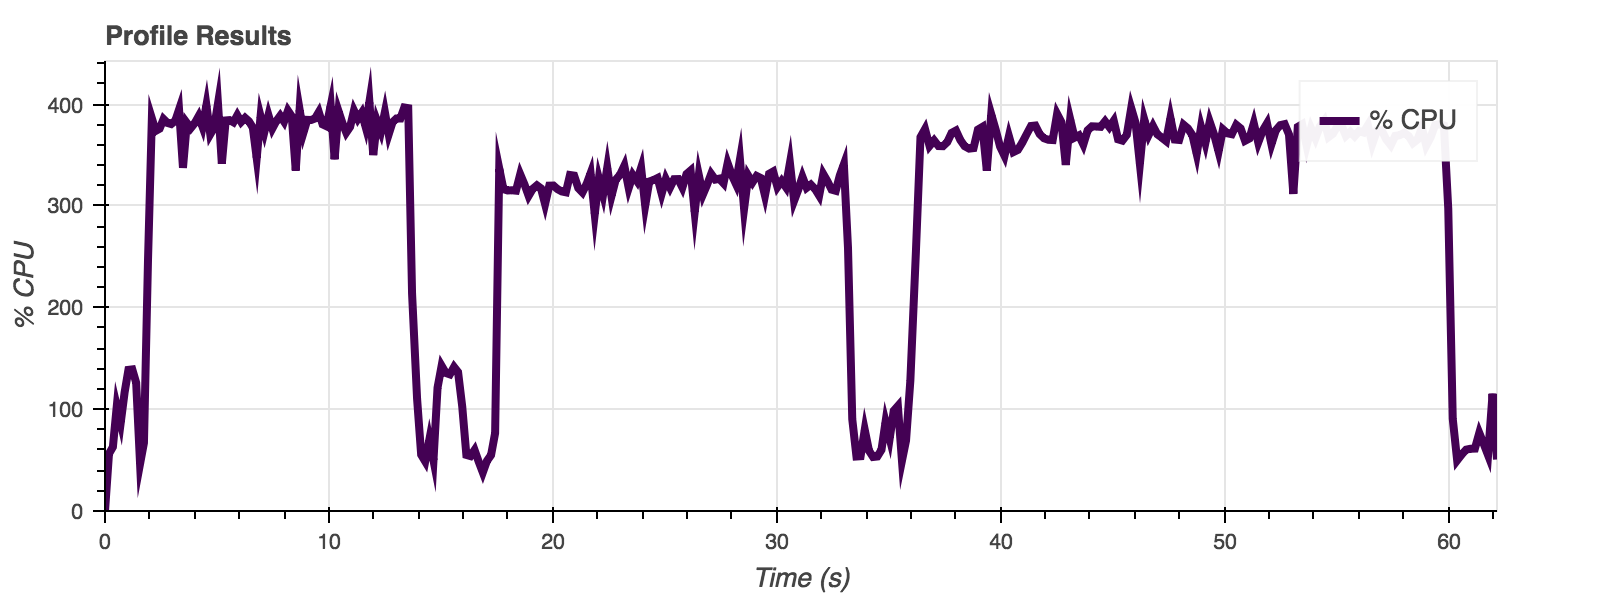
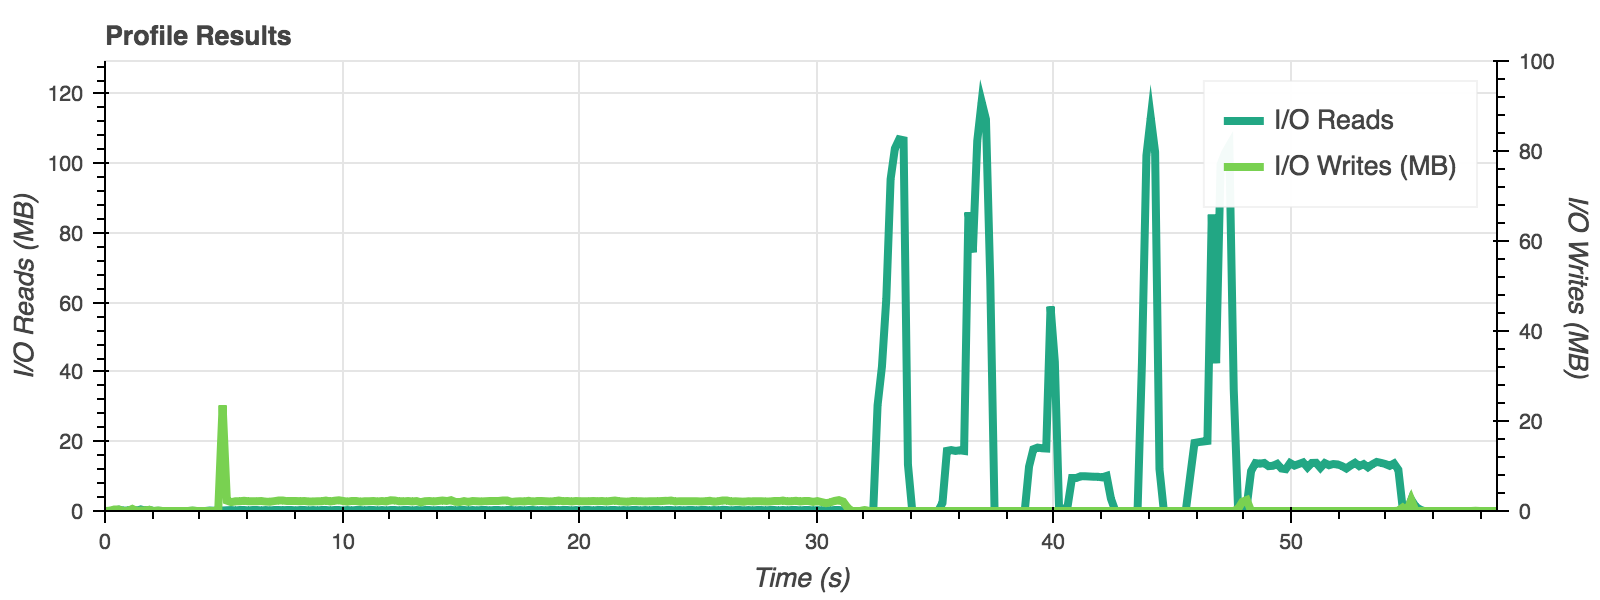
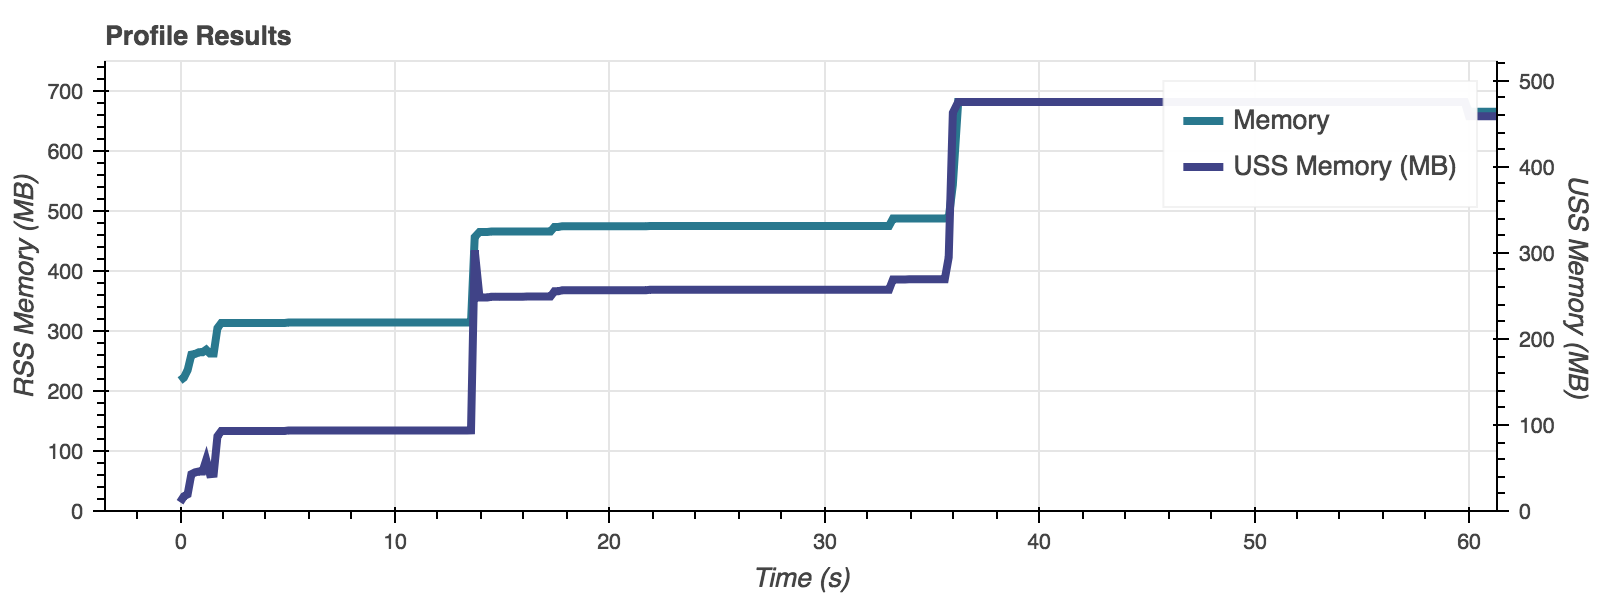
Data is returned in two primary forms: as a set of pre-defined statistics defining the performance of a particular test, and a set of time-series plots detailing the resource usage over the run time of a test. The metrics are returned from the 'execute' functions. They are also optionally written to a 'CSV' file or a MongoDB database.
- CSV file
- MongoDB