User Manual
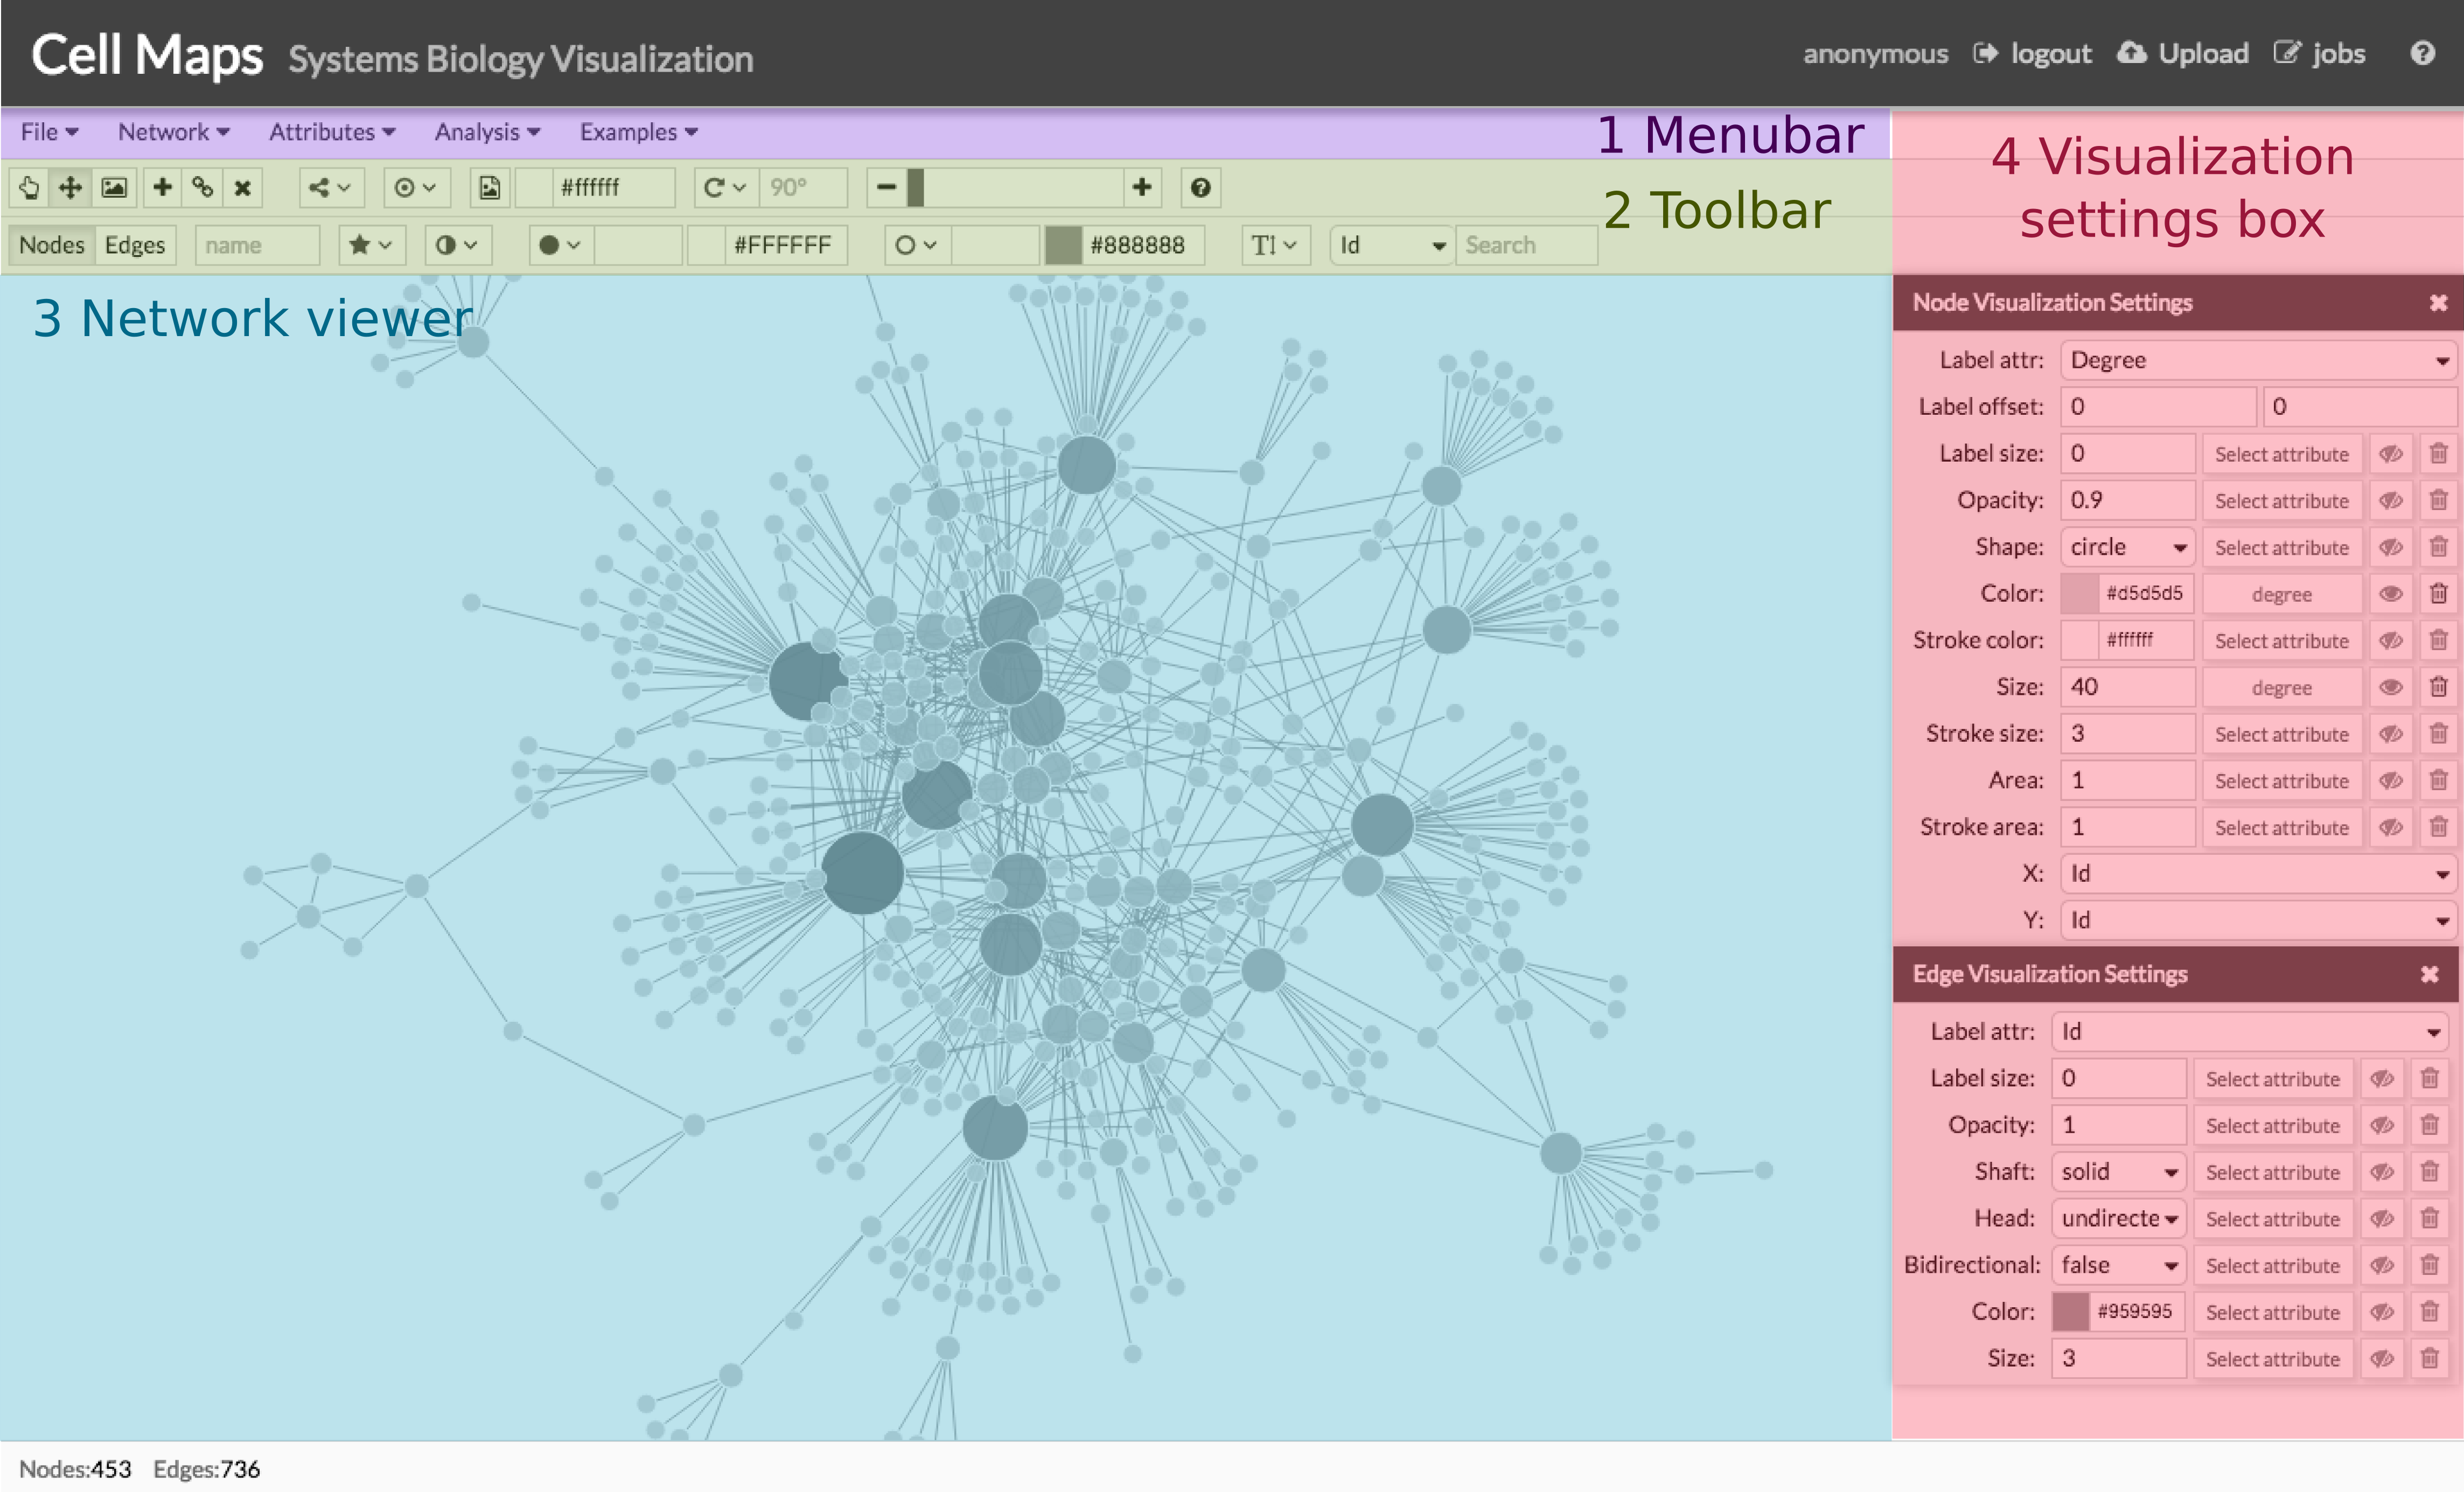
CellMaps web comprises four components (see image below). From the top to the bottom:
- Menu bar, which has the menus for the three main CellMaps functions.
- Tool bar, which includes the options for commonly used functions like editing and configuring the network layouts and its elements.
- Network viewer, the visualization window that displays the network.
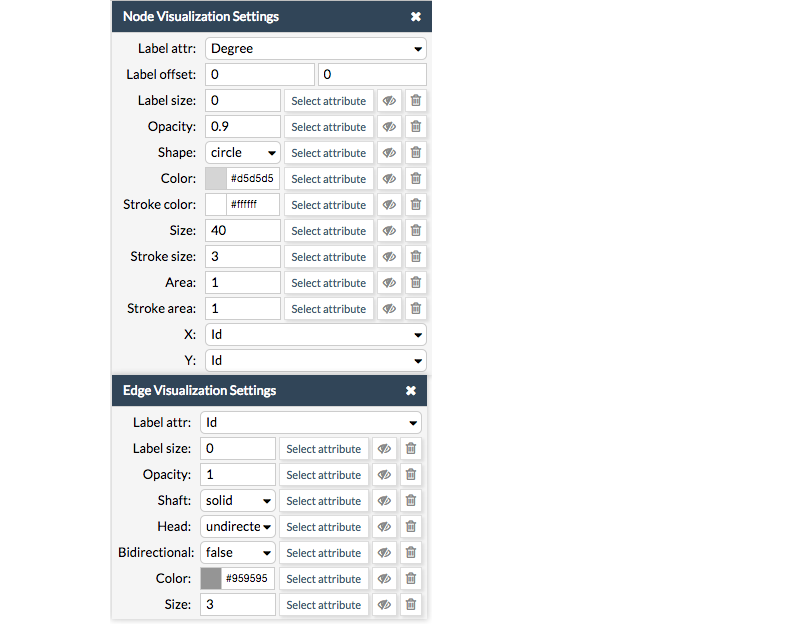
- Visualization settings box (on the right), which allows to configure the default network visualization and to integrate attributes information.
The menu bar has three elements, which takes the three general function menus.

The File menu contains the basic functionality for file management like opening and saving CellMaps sessions as .json files and downloading a snapshot of the current network viewer window as an image.
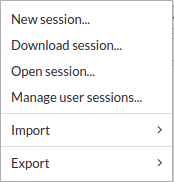
The Network menu allows you to import networks from external databases such as REACTOME, KEGG and IntAct as well as the functionalities to select network elements or change the network layout. Find more information in the Loading and editing network section.

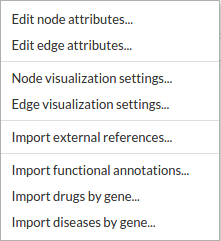
The Attributes menu allows the users to add and edit additional information of the network and its elements. These attributes can be imported from an user file, an external database or can be created through the edition box (more information in the Loading and editing attributes section). The attributes assigned to the network elements can used to custom the network visual parameters.
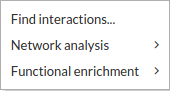
The Analysis menu allows users to apply extra functionalities to CellMaps, like performing analysis on the network and its attributes (more information in the Analysis section).
The toolbar includes the commonly used functions for editing and configuring the network, nodes and edges. To see the description of each button, put the mouse pointer over and wait momentarily for a tooltip.
![toolbar] (../wiki/images/toolbar.png)
The following table describes each of the toolbar buttons.
| Icon | Name | Description |
|---|---|---|
 |
Nodes/edges mode | Select nodes and edges |
 |
Network mode | Move the whole network along the canvas |
 |
Background mode | Select and move the background images |
 |
Add mode | Add nodes |
 |
Join mode | Join nodes by an edge |
 |
Delete mode | Delete the selected node / edges |
 |
Layout | Render the whole graph using different algorithms. Default: force directed |
 |
Select | Select nodes, vertices or both |
 |
Background | Change the color of the background, select a predefined image or upload your own image |
 |
Zoom | Increase or decrease the network view |
 |
Node Name | Show and edit the name of the selected node |
 |
Edge Name | Show and edit the name of the selected edge |
 |
Node Shape | Change the shape of the selected node(s) |
 |
Edge Shape | Change the shape of the selected edge(s) |
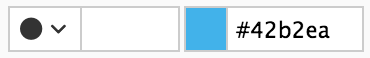 |
Node fill color & size | Change the color and size of the selected node(s) |
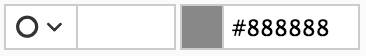 |
Node stroke color & size | Change the border color and size of the selected node(s) |
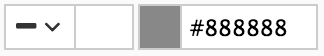 |
Edge fill color & size | Change the color and size of the selected edge(s) |
 |
Opacity | Changes the transparency of the selected node/edge(s) |
 |
Label size | Change the font size of the node/edge(s) labels |
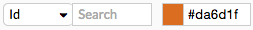 |
Search | Search nodes or edges according the node id or an attribute (ex. node name). Also you can choose the color used to highlight your search (orange by default) |
#Visualization settings box
CellMaps allows the user to configure the visual properties of the network elements (either nodes and edges) by assigning a direct parameter value (default) or creating a visual style dependent on the attributes associated to the network elements (attribute dependent). You will find a full description of these functionalities in the Network and attributes visualization section.
The Network Viewer Pane displays all the nodes and edges of the network and it is used to arrange and navigate around the elements of the network. The bottom right rectangle indicates the section of the network displayed in the network viewer window.

For a detailed tutorial of CellMaps functionalities, see the following sections:
- Loading and editing networks Tutorial about how to load or create networks.
- Loading and editing attributes Tutorial about how to load or create attributes.
- Network and attributes visualization Describes how to configure the visual style of the network and use the network attributes.
- Analysis List and description of available analysis