-
Notifications
You must be signed in to change notification settings - Fork 13
nonhydrostatic mountain test case
This page documents our progress with implementing the non hydrostatic mountain test case as described by Melvin et. al. (QJRMS 2010). The parameters in that paper are as follows:
Domain: 144km x 35km
dx: 0.4km
dz: 0.25km
dt: 5s
N: 0.01s^-1
T(at surface): 300K
U: 10ms^-1
We run with the same parameters except that we use dx = 0.8km and dz = 0.5km and keep the same timestep since we are using a higher order scheme.
The code is run in a 2D vertical slice with a sponge layer applied to the vertical velocity in the upper 10km of the domain. The sponge term is applied implicitly and the sponge function mu is defined by:
mu = mbar * sin^2((pi/2) (z-zc)/(H-zc)) for z > zc, mu = 0 otherwise
where mubar is a constant, set to 15./dt as in Melvin et. al.
The profile of the mountain is
zs(x) = ha^2/(x^2+a^2)
where a=1km is the half width of the mountain and h=1m is the height of the mountain.
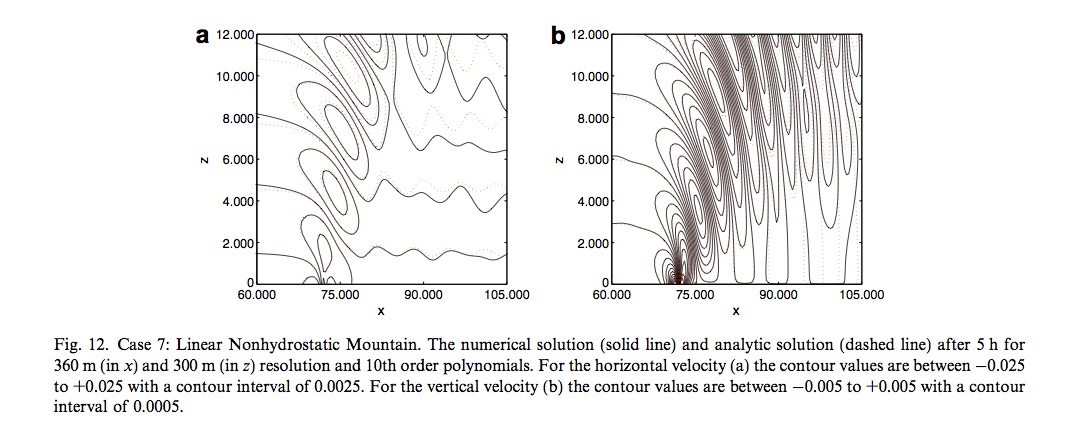
The reference solution is shown below.

Also useful is the reference solution from Giraldo and Restelli 2007 because they give the min and max values of the vertical velocity.

Giraldo and Restelli use a sponge layer in the lateral direction - something that we haven't yet investigated. They also compare their solution the analytic solution and compute vertical momentum fluxes normalised by the analytic vertical momentum flux - this could be an interesting diagnostic to compute.
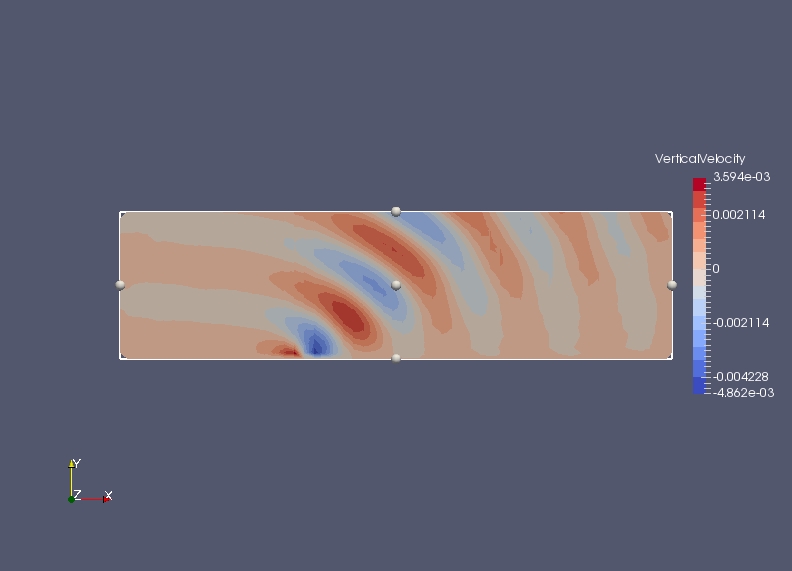
The picture below shows the vertical velocity after 5hrs. It was produced using the hybrid SUPG-DG upwind option for advecting the potential temperature. The colour scale has 14 levels and ranges from -0.0048 to 0.0036 so that the lines between the colours can be compared with the contours in the figure from Melvin above.

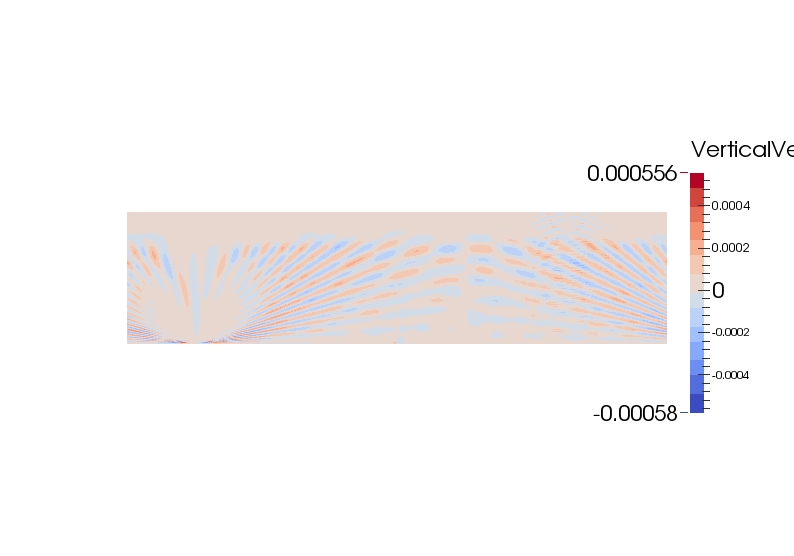
This shows that we can reproduce the main features of the non hydrostatic mountain test - the wave fronts have the same tilt. There are two concerns: firstly the wave length is not quite correct (there is an additional trough in the upper right hand corner of Melvin's plot) and secondly there seems to be some remaining 'noise' from the initial response to the mountain (which has propagated out of the right hand side of the domain and back in on the left by this time). This is seen more clearly in the movie.
- initialise using the full velocity space
- run for longer to see what the steady state looks like
- reflections from sponge layer? Try with a deeper domain. Try ensuring mesh is flat at the edge of the sponge layer.
- run with backward Euler
- add a lateral sponge layer
- reduce SUPG parameter, or turn off SUPG entirely
- reduce timestep incase this is a problem with the accuracy of the advection scheme (inspired by comparison with Melvin's figure 6b which is from a run with a higher Courant number and seems to be starting to show the same issues we're seeing here)
- why don't we see this with the gravity wave test? Try running the gravity wave with a deformed mesh, and also some advection tests for theta and rho. Could also run the gravity wave with no mean flow and add a mountain.


doubling number of grid points in x and z direction and halving timestep
