

You will be given historical sales information for various stores in various geographies. Each store features a variety of categories, each with its own set of weekly sales.
- Date attributes represents the week
- The term "holiday" relates to whether the week is a special holiday week.
Load the sales data from the supplied file"sales .csv", which contains historical sales data from different categories. Load the weather data from the supplied file"weather .csv", shows the average temperature in each retail region over time. Load the fuel pricing data from the supplied file"fuel .csv", which contains historical fuel prices for the region.
Then perform the following functions:
Examine your datasets with Pandas, which displays all columns and their data types, the top ten for each dataset, and basic statistics for numeric columns (Count, mean, std, min, max). Add your comments about the data Show the missing data and incorrect values for each column, such as zeros or negative sales. Decide how you want to handle missing and incorrect values and implement it. Merge all datasets into data frame based on the date and store.
Make a chart to illustrate if weekly sales are increasing or decreasing over time. Make a chart to show how much each brand sells. Determine the top ten selling stores. Make a histogram to show the top 10 stores sales. Create a chart that compares average weekly sales for the top ten selling stores during holidays and non-holidays. Create a chart that displays the average weekly sales for each brand department for the top 10 selling stores. Make a line chart to show the relationship between weekly sales and weather Temperature. Make a line chart to show the relationship between the cost of fuel and weather weekly sales.
we will work on the mirged csv file
- A model is a mathematical representation of a real-world process.
- It is a program that improves its performance at some task through experience.

- Supervised Learning
- Unsupervised Learning
- Reinforcement Learning
- Semi-supervised Learning
- Supervised learning is the machine learning task of learning a function that maps an input to an output based on example input-output pairs.
- A type of machine learning algorithm used to draw inferences from datasets consisting of input data
WITHOUT LABELED RESPONSES.
- An area of machine learning concerned with how software agents should to take actions in an environment in order to
maximize the notion of cumulative reward.
- A class of machine learning tasks and techniques that also
make use of unlabeled data for training.
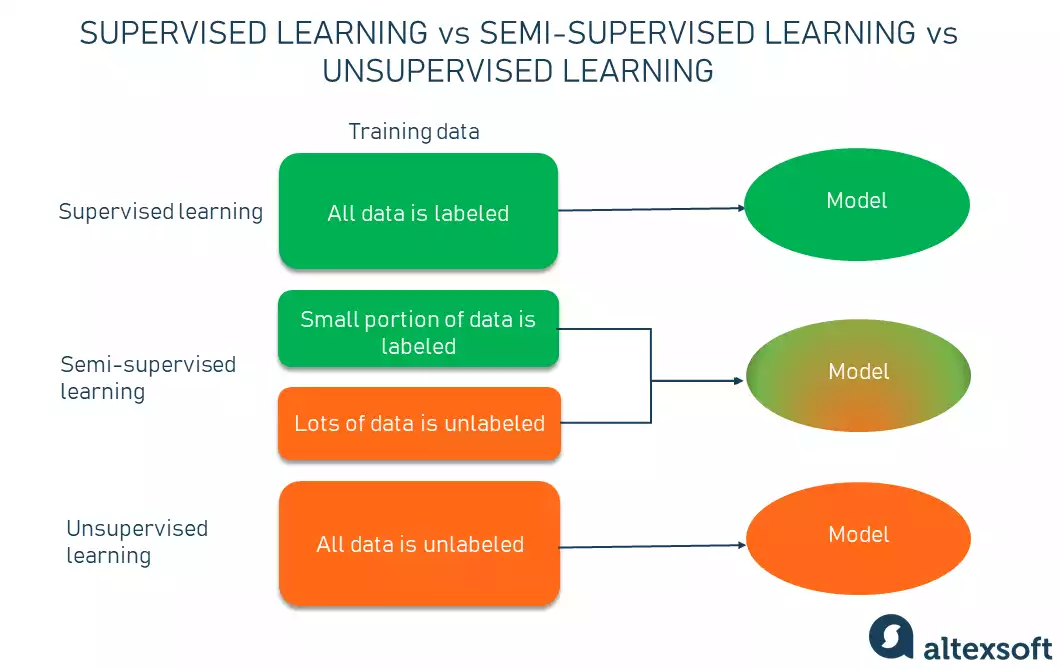
- SL aims to learn a function that, given a sample of data and
desired outputs,approximatesa function that maps inputs to outputs. - Semi-SL aims to
label unlabeled datapoints using knowledge learnedfrom a small number of labeled datapoints.
To forecast weekly sales, we need to create a machine learning model:
Divides the data into training and testing categories (80 percent training data and 20 percent testing data). Create two separate supervised learning models to forecast weekly sales based on specific characteristics. Compare the accuracy of the two models (in percentages). Create a clustering model to group together store categories with similar sales. Which number of Clusters is the best? Why?
3 or 4 clusters,