Feature: Task Killer
Provide a way to kill tasks in Cockpit, to test garbage collection and allow a person using Cockpit to manually free up resources on the client machine (the computer running the browser) as well as the server (in tasks that require heavy IO, etc.).
This feature is meant primarily as a debugging tool.
John is a administrator. He uses his Cockpit session to manage several machines. When he disconnects from a machine, he still finds his browser to be sluggish. He wants to figure out why that is, and see if there is anything he can do about it.
Provide a quick glance at resources used and have a method for killing off a part of Cockpit. This feature is mainly for manual garbage collection.
Non-developers should not be using this in a normal situation. Killing off parts of Cockpit should not be necessary in normal usage.
After discussion, we have rescoped this feature to mainly target those who develop Cockpit. What would be easiest to interact with is a "global" hotkey (such as Alt+Esc or something similar) which would then bring up a simple task dialog, providing some minor details (as discussed below in resources) and a way to kill off tasks.
TBD
Naturally, this needs modification. Ideally, it would be nice to have just the tbody scrollable, with affixed headers. Also, the inline CSS should move to classes (or current classes could be used if they apply)... and tr classes should be evaluated.
This is the HTML used for the mockup:
<div class="modal-content">
  <div class="modal-header">
    <button type="button" class="close" data-dismiss="modal" aria-hidden="true">
      <span class="pficon pficon-close"></span>
    </button>
    <h4 class="modal-title" id="myModalLabel">Active Tasks</h4>
  </div>
  <div class="modal-body" style="
    overflow: auto;
    max-height: 75vh;
    padding: 0;
    ">
    <table class=" listing listing-ct" style="
      width: 100%;
      margin: 0;
      ">
      <thead>
        <tr>
          <th>Task Name</th>
          <th>Memory</th>
        </tr>
      </thead>
      <tbody>
        <tr class="listing-ct-item listing-ct-nonavigate listing-ct-noexpand"><td> cockpit1:localhost/system </td><td> 82 kb </td></tr>
        <tr class="listing-ct-item listing-ct-nonavigate listing-ct-noexpand"><td> cockpit1:localhost/dashboard </td><td> 1 kb </td></tr>
        <tr class="listing-ct-item listing-ct-nonavigate listing-ct-noexpand"><td> cockpit1:localhost/kubernetes </td><td> 2 kb </td></tr>
        <tr class="listing-ct-item listing-ct-nonavigate listing-ct-noexpand"><td> cockpit1:localhost/kubernetes/registry </td><td> 22 kb </td></tr>
        <tr class="listing-ct-item listing-ct-nonavigate listing-ct-noexpand"><td> cockpit1:localhost/storage </td><td> 1 kb </td></tr>
        <tr class="listing-ct-item listing-ct-nonavigate listing-ct-noexpand"><td> cockpit1:localhost/docker </td><td> 5 kb </td></tr>
        <tr class="listing-ct-item listing-ct-nonavigate listing-ct-noexpand active"><td> cockpit1:localhost/network </td><td> 222 kb </td></tr>
        <tr class="listing-ct-item listing-ct-nonavigate listing-ct-noexpand"><td> cockpit1:localhost/machines </td><td> 82 kb </td></tr>
        <tr class="listing-ct-item listing-ct-nonavigate listing-ct-noexpand"><td> cockpit1:localhost/system/services </td><td> 22 kb </td></tr>
        <tr class="listing-ct-item listing-ct-nonavigate listing-ct-noexpand"><td> cockpit1:localhost/system/logs </td><td> 82 kb </td></tr>
        <tr class="listing-ct-item listing-ct-nonavigate listing-ct-noexpand"><td> cockpit1:localhost/selinux/setroubleshoot </td><td> 82 kb </td></tr>
        <tr class="listing-ct-item listing-ct-nonavigate listing-ct-noexpand"><td> cockpit1:localhost/subscriptions </td><td> 82 kb </td></tr>
        <tr class="listing-ct-item listing-ct-nonavigate listing-ct-noexpand"><td> cockpit1:localhost/fleet-commander-admin </td><td> 19 kb </td></tr>
        <tr class="listing-ct-item listing-ct-nonavigate listing-ct-noexpand"><td> cockpit1:localhost/playground/react-patterns </td><td> 22 kb </td></tr>
        <tr class="listing-ct-item listing-ct-nonavigate listing-ct-noexpand"><td> cockpit1:localhost/system/terminal </td><td> 22 kb </td></tr>
        <tr class="listing-ct-item listing-ct-nonavigate listing-ct-noexpand"><td> cockpit1:localhost/updates </td><td> 22 kb </td></tr>
        <tr class="listing-ct-item listing-ct-nonavigate listing-ct-noexpand"><td> cockpit1:localhost/kdump </td><td> 82 kb </td></tr>  </tbody>
    </table>
  </div>
  <div class="modal-footer">
    <button type="button" class="btn btn-default" data-dismiss="modal">Cancel</button>
    <button type="button" class="btn btn-primary">End Task</button>
  </div>
</div>
</div>
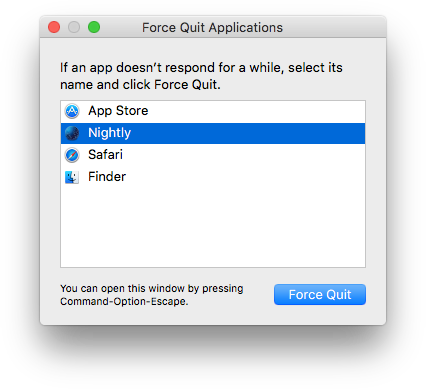
| Friendly(-ish) | Details overload |
|---|---|
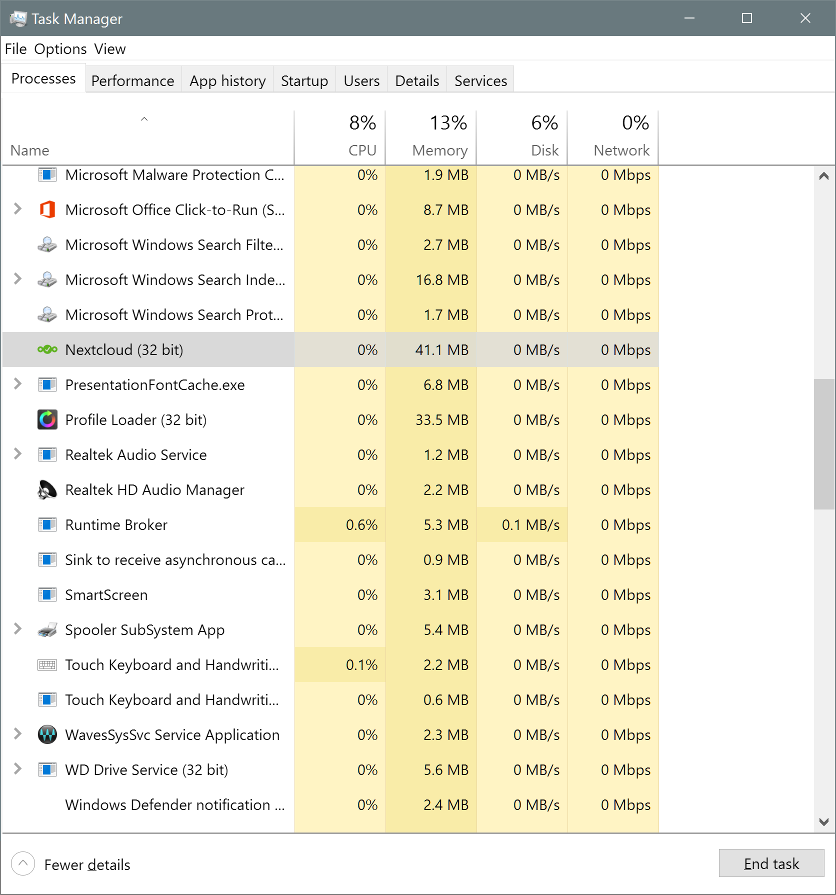 |
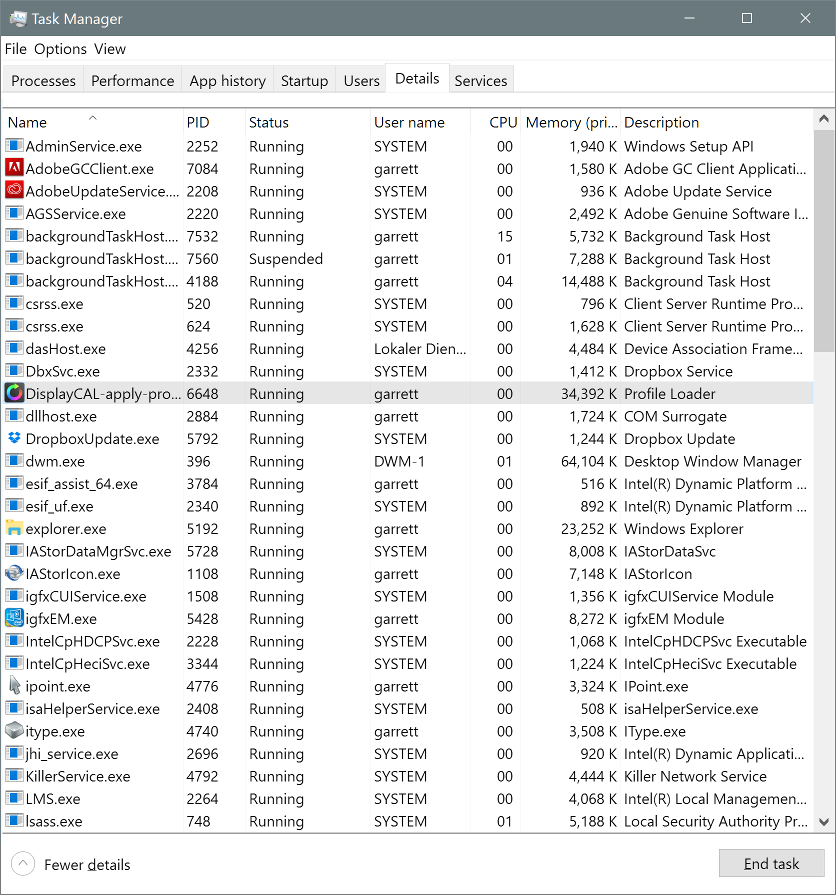 |
It would be nice to have some sort of stats for resource usage for each iframe. A lot of metrics we'd want to use are probably only available at a browser-level, instead of within the page. However, there should be some JS APIs we can use to display performance.
- Navigation Timing / Performance API
- Very broad browser support: http://caniuse.com/#feat=nav-timing
- Docs: https://developer.mozilla.org/en-US/docs/Web/API/Navigation_timing_API
- Quick overview: https://www.html5rocks.com/en/tutorials/webperformance/basics/
- Using Navigation Timing on
iframes: http://stackoverflow.com/questions/9944170/using-the-new-javascript-performance-timing-api-on-iframes -
performance.getEntries()to get a list of various loaded resources and the stats (modify foriframeusage, of course) -
Chrome hasperformance.memory(Firefox does not) — the about might need to be different between browsers, as it would be great to have actual memory values instead of approximates or (essentially) made-up resource measurements- Don't use: It doesn't work in Chrome anyway (just reports heap sizes, unless one runs with an experimental command-line flag) http://docs.webplatform.org/apis/timing/properties/memory/
- Resource measurement I've figured out based on performance API, for render time (which should roughly indicate complexity of page) and resource usage (on load, not additional usage while manipulating the page):
-
Snippet showing the DOM render time for each
iframe(run in dev console):$('iframe').each(function(i, iframe){ console.log(iframe.name, iframe.contentWindow.performance.timing.domComplete - iframe.contentWindow.performance.timing.domLoading); })
-
Snippet to display the decoded (uncompressed in RAM) file sizes (which should be roughly equivalent with memory size) — note that this doesn't take into account actual RAM usage of the page in use, only the RAM used for resources (scripts, images, etc.):
$('iframe').each(function(i, iframe){ console.log(iframe.name, iframe.contentWindow.performance.getEntries({entryType: "resource"}).reduce(function(prev, el){ return (prev.decodedBodySize || 0) + (el.decodedBodySize || 0) })); });
-
- querySelector
-
document.querySelectorAll('*').lengthcan be a very crude indicator on elements in the DOM; this could be used per iframe - it's generally not a great metric, as it doesn't count interactivity, memory usage, or other things (as it does take some elements longer to render than others)
-