Nvidia GPU exporter for prometheus, using nvidia-smi binary to gather metrics.
Warning
Maintenance Status: I get that it can be frustrating not to hear back about the stuff you've brought up or the changes you've suggested. But honestly, for over a year now, I've hardly had any time to keep up with my personal open-source projects, including this one. I am still committed to keep this tool working and slowly move it forward, but please bear with me if I can't tackle your fixes or check out your code for a while. Thanks for your understanding.
There are many Nvidia GPU exporters out there however they have problems such as not being maintained, not providing pre-built binaries, having a dependency to Linux and/or Docker, targeting enterprise setups (DCGM) and so on.
This is a simple exporter that uses nvidia-smi(.exe) binary to collect, parse and export metrics.
This makes it possible to run it on Windows and get GPU metrics while gaming - no Docker or Linux required.
This project is based on a0s/nvidia-smi-exporter. However, this one is written in Go to produce a single, static binary.
If you are a gamer who's into monitoring, you are in for a treat.
- Will work on any system that has
nvidia-smi(.exe)?binary - Windows, Linux, MacOS... No C bindings required - Doesn't even need to run the monitored machine: can be configured to execute
nvidia-smicommand remotely - No need for a Docker or Kubernetes environment
- Auto-discovery of the metric fields
nvidia-smican expose (future-compatible) - Comes with its own Grafana dashboard
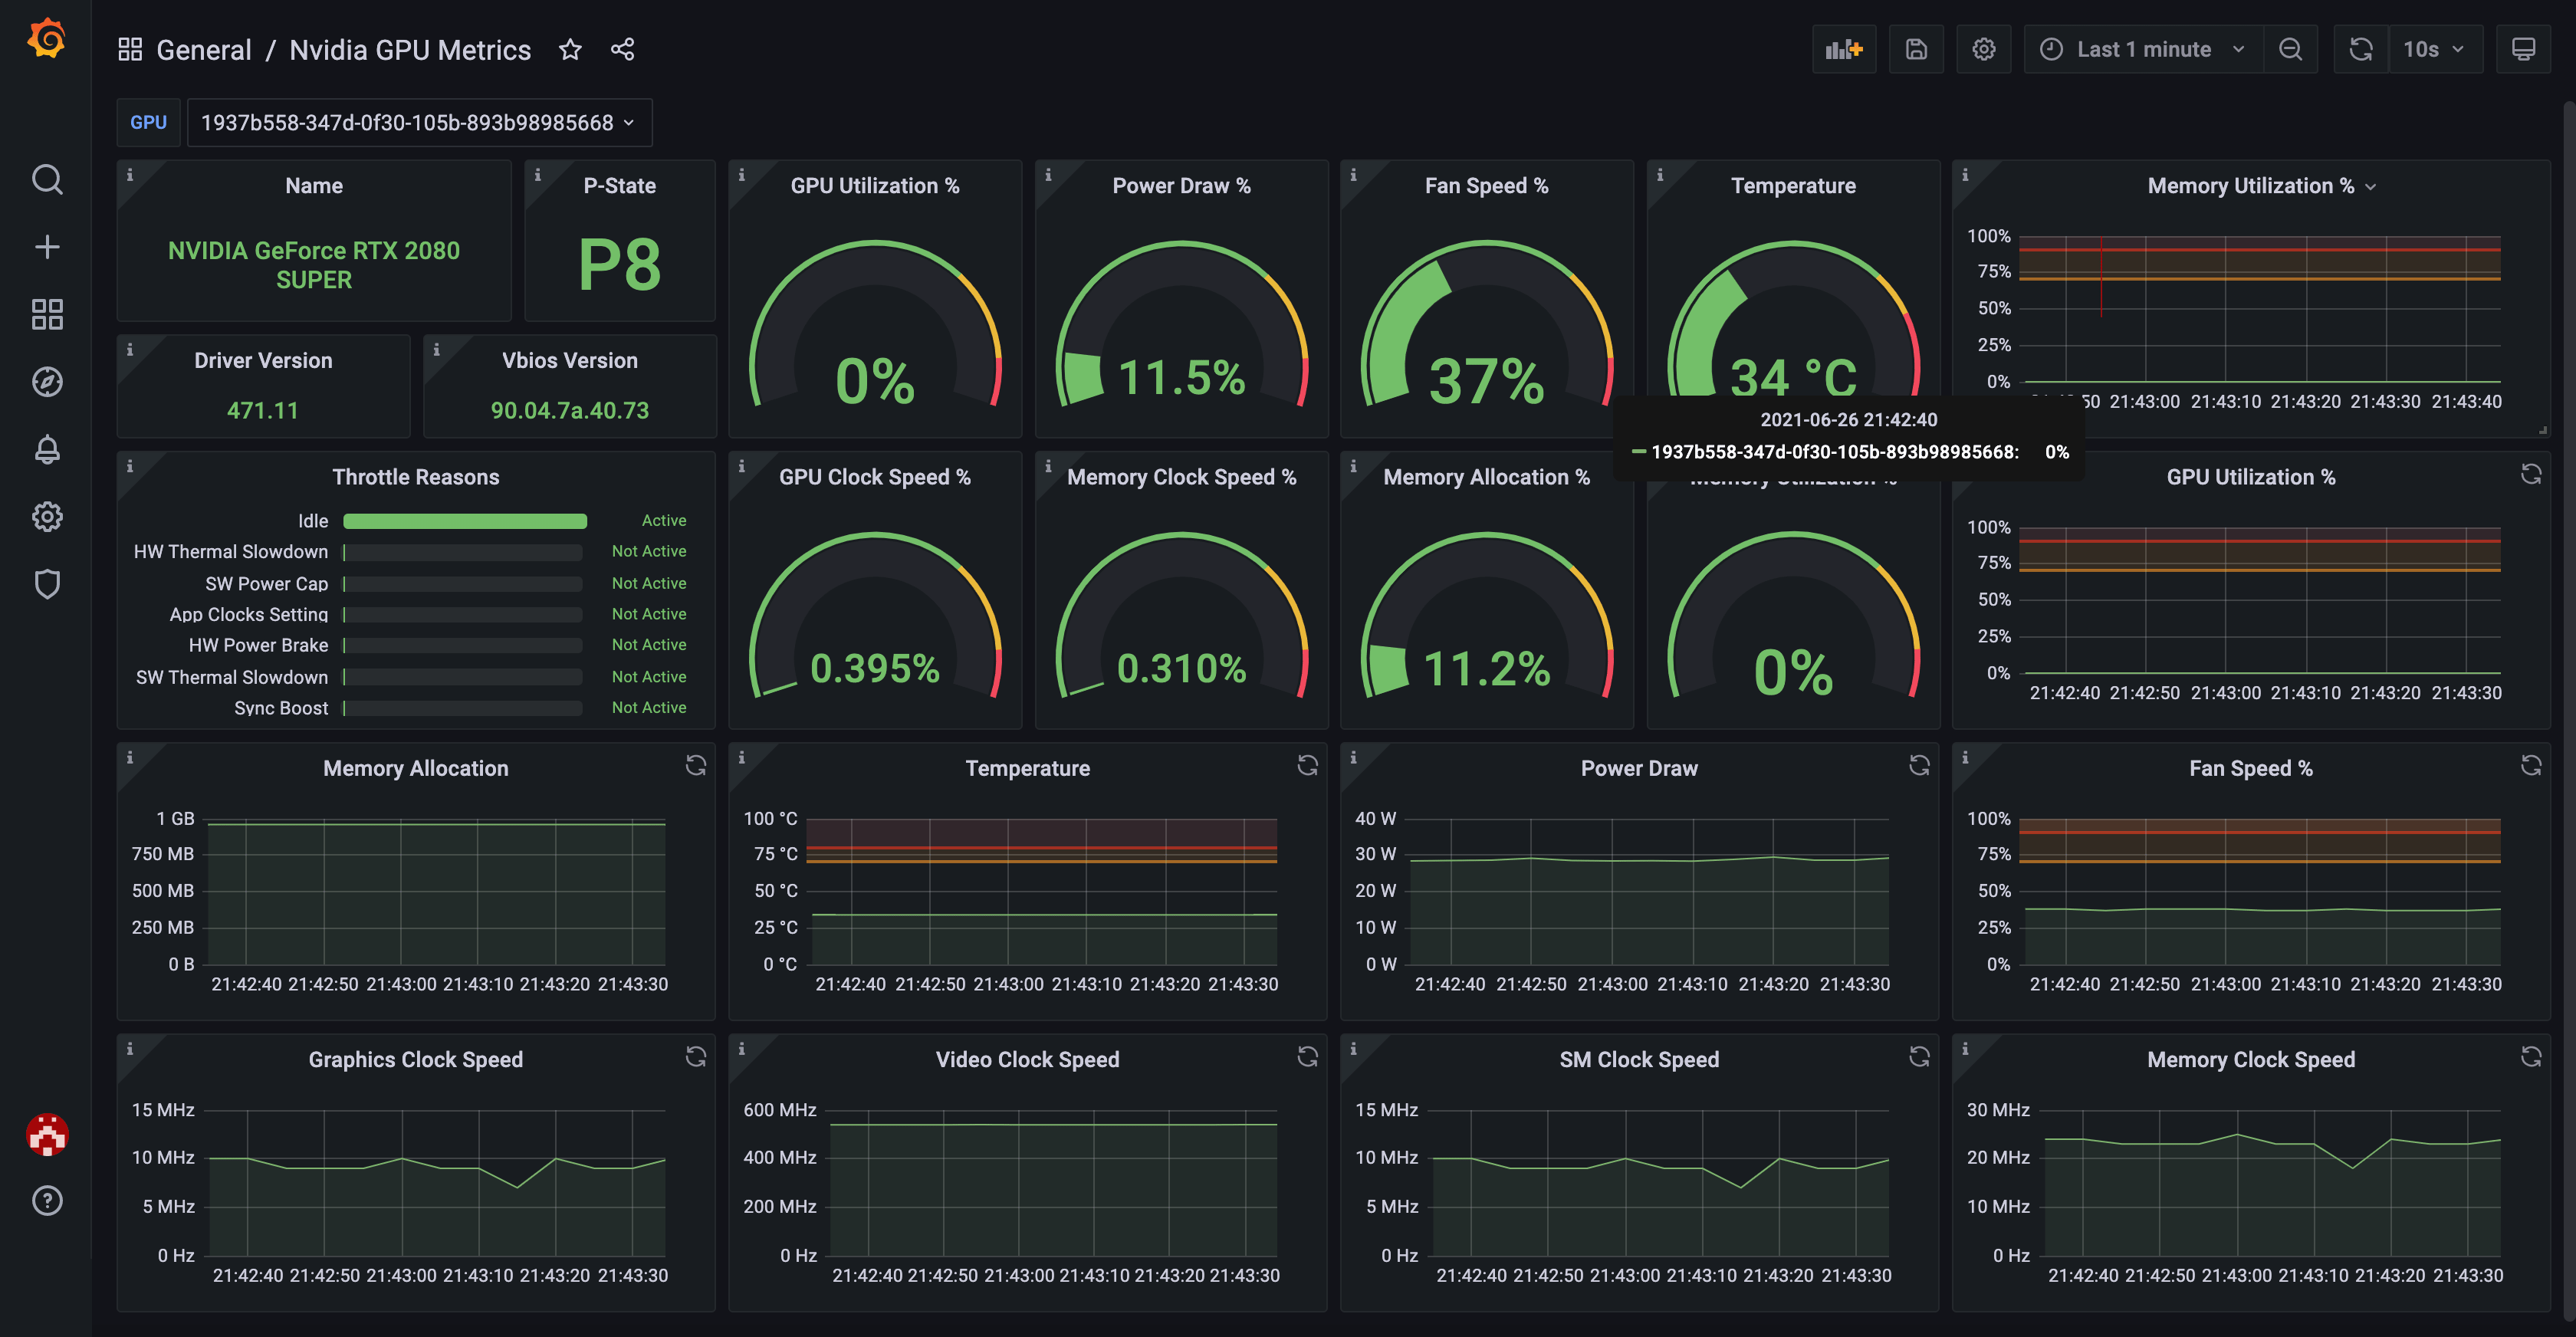
You can use the official Grafana dashboard to see your GPU metrics in a nicely visualized way.
See INSTALL.md for details.
See CONFIGURE.md for details.
See METRICS.md for details.
See CONTRIBUTING.md for details.


