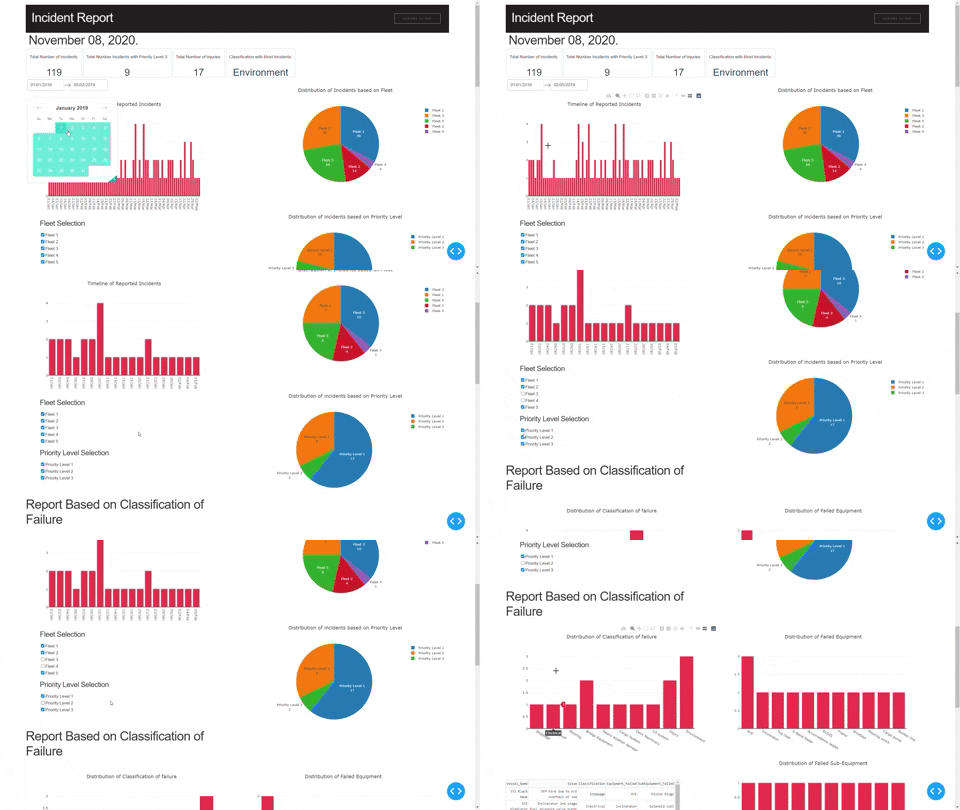
This App uses Dash By plotly to create an analytical web application which analyzes the classified incident records and generates interactive data visualizations which help gather meaningful insights from the data. The DashBoard produces interactive visualizations which enable the user to drill down to the root cause of the incident and it does so by using custom cross filters put in place considering the desired output of the individual.
- Fleet Number to which the vessel belongs.
- Classification of Failure.
- Type of Failure.
- Equipment Failed.
- Sub-Equipment Failed.
- Make/Model of the Sub/Equipment Failed (subject to availability).
The Vessel Name and Issue and Report Date together act as the unique identification (Key) for each Incident occurred. The DashBoard allows the user to analyze the data using multiple basic and cross filters. The Basic Filters being Report Date, Priority Level of the Issue and Fleet Number to which the Vessel belongs. These fields were chosen as the basic filters since they were common to every record present and provided a logical flow when drilling down to the root cause of the failure. The Report date provides a filter over the time frame, to analyze the data and Priority Level and Fleet Number provide Meta information
Next up we have the cross filters which allow us to shift focus based on what type of insights we desire to obtain. The First Cross Filter,Classification of Failure categorizes the incidents occurred into Various Sub-Classifications such as Environment, Stoppage, Electrical, Mooring, Bridge Equipment failure, Heavy weather damage, Cargo System failure, Steam plant failure, Injury, Deck Machinery failure, LO system failure, Structure failure, FO System failure, Medical, Start failure.
Similarly, Type of Failure also provides grouping based on the type of failure occurred. Various Subtypes include Garbage Disposal Machinery Breakdown Electrical Component Rope Failure Equipment damage, FO Spill, Mechanical, injury, Hydraulic, Oil spill, Cargo spill, Bunker spill, Structural Damage, Medical, Contamination, ECA violation.
By default, DashBoard runs on localhost - you can only access it on your own machine provided you have Python 3.7. Or later installed. To share the DashBoard, you need to "deploy" your Dash app to a server and open up the server's firewall to the public or to a restricted set of IP addresses. DashBoard uses Flask under the hood. This makes deployment very easy: you can deploy the DashBoard app just like you would deploy a Flask app. Almost every cloud server provider has a guide for deploying Flask apps.Although Heroku seems to be the best of the best. Here is a simple example. This example requires a Heroku account, git, and virtualenv.
-
Step 1. Create a new folder for your project: $ mkdir dash_app_example $ cd dash_app_example
-
Step 2. Initialize the folder with git and a virtualenv $ git init # initializes an empty git repo $ virtualenv venv # creates a virtualenv called "venv" $ source venv/bin/activate # uses the virtualenv virtualenv creates a fresh Python instance. You will need to reinstall your app's dependencies with this virtualenv: $ pip install dash $ pip install plotly You will also need a new dependency, gunicorn, for deploying the app: $ pip install gunicorn
-
Step 3. Initialize the folder with a sample app (app.py), a .gitignore file, requirements.txt, and a Procfile for deployment App.py contains the code and logic of the app
.gitignore venv *.pyc .DS_Store .env
Procfile web: gunicorn app:server (Note that app refers to the filename app.py. server refers to the variable server inside that file).
requirements.txt requirements.txt describes your Python dependencies. You can fill this file in automatically with: $ pip freeze > requirements.txt
-
Step 4. Initialize Heroku, add files to Git, and deploy $ heroku create my-dash-app # change my-dash-app to a unique name $ git add . # add all files to git $ git commit -m 'Initial app boilerplate' $ git push heroku master # deploy code to heroku $ heroku ps:scale web=1 # run the app with a 1 heroku "dyno" You should be able to view your app at https://my-dash-app.herokuapp.com (changing my-dash-app to the name of your app).
-
Step 5. Update the code and redeploy When you modify app.py with your own code, you will need to add the changes to git and push those changes to heroku. $ git status # view the changes $ git add . # add all the changes $ git commit -m 'a description of the changes' $ git push heroku master


