Traffic Server CI
GoDaddy has generously contributed a set of hosts on which we run our CI. The CI runs on a per-PR basis as well as on per-branch basis as changes get merged into those branches. The CI is implemented using Jenkins. This page documents how contributors to Traffic Server can interact with the CI system.
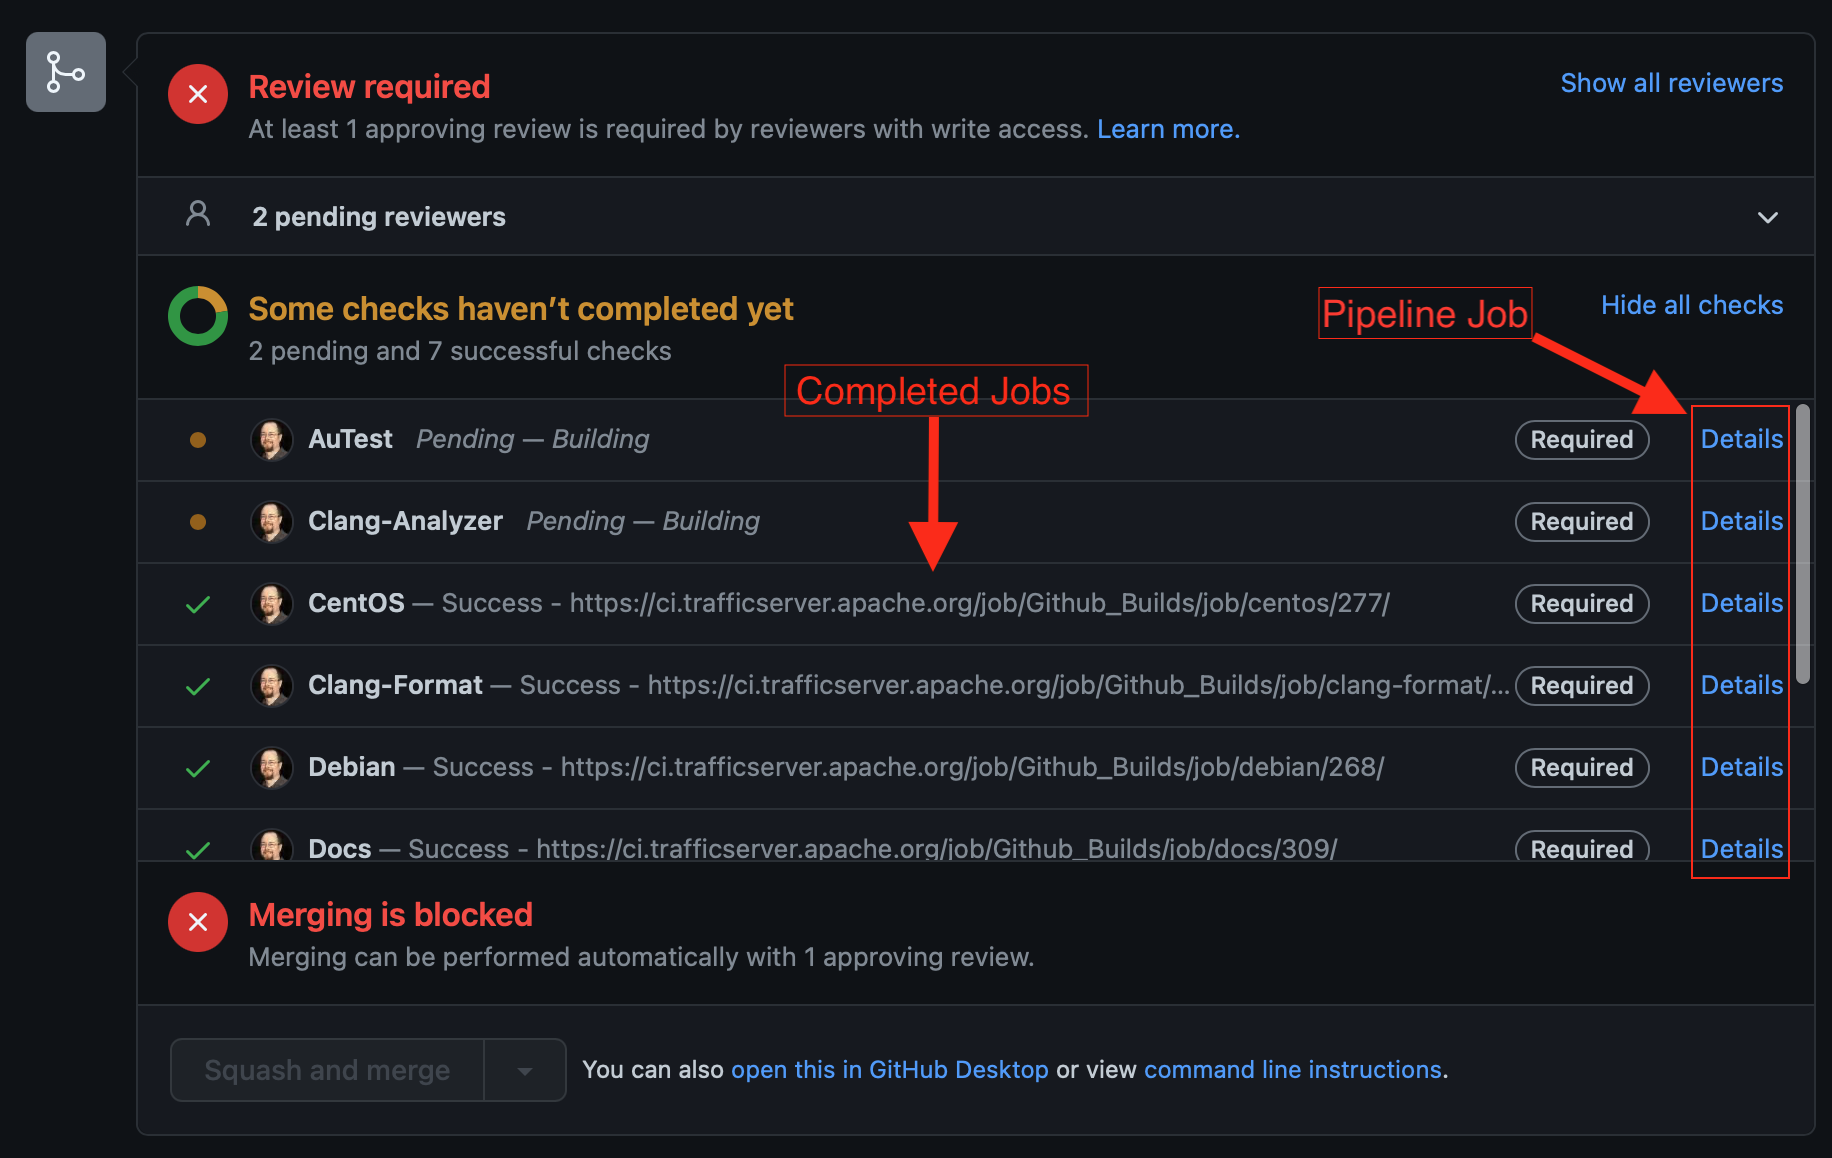
When a contributor submits an Apache Traffic Server PR, Github is configured via a web hook to send a POST request to the Jenkins controller. The controller then kicks off a build of the Github PR Pipeline which starts the builds associated with the CI for that PR. The status of those builds are communicated back to Github as they run and complete. The CI results are displayed in Github's PR page with something that looks like this:
For Github PRs, the CI will run the builds in two stages:
- Docs, RAT, clang-format
- OS builds, clang-analyzer, autests
The first stage runs quickly and functions as a sanity check on basic aspects of the patch. The second stage only runs if the first stage completes successfully.
The Jenkins Pipeline that runs the various builds associated with testing the PR (docs, RAT, autest, etc.), has a very thin Jenkins configuration. The majority of the specification for Traffic Server's PR CI projects are checked in as Pipeline (Groovy) scripts and can be found at apache/trafficserver-ci.
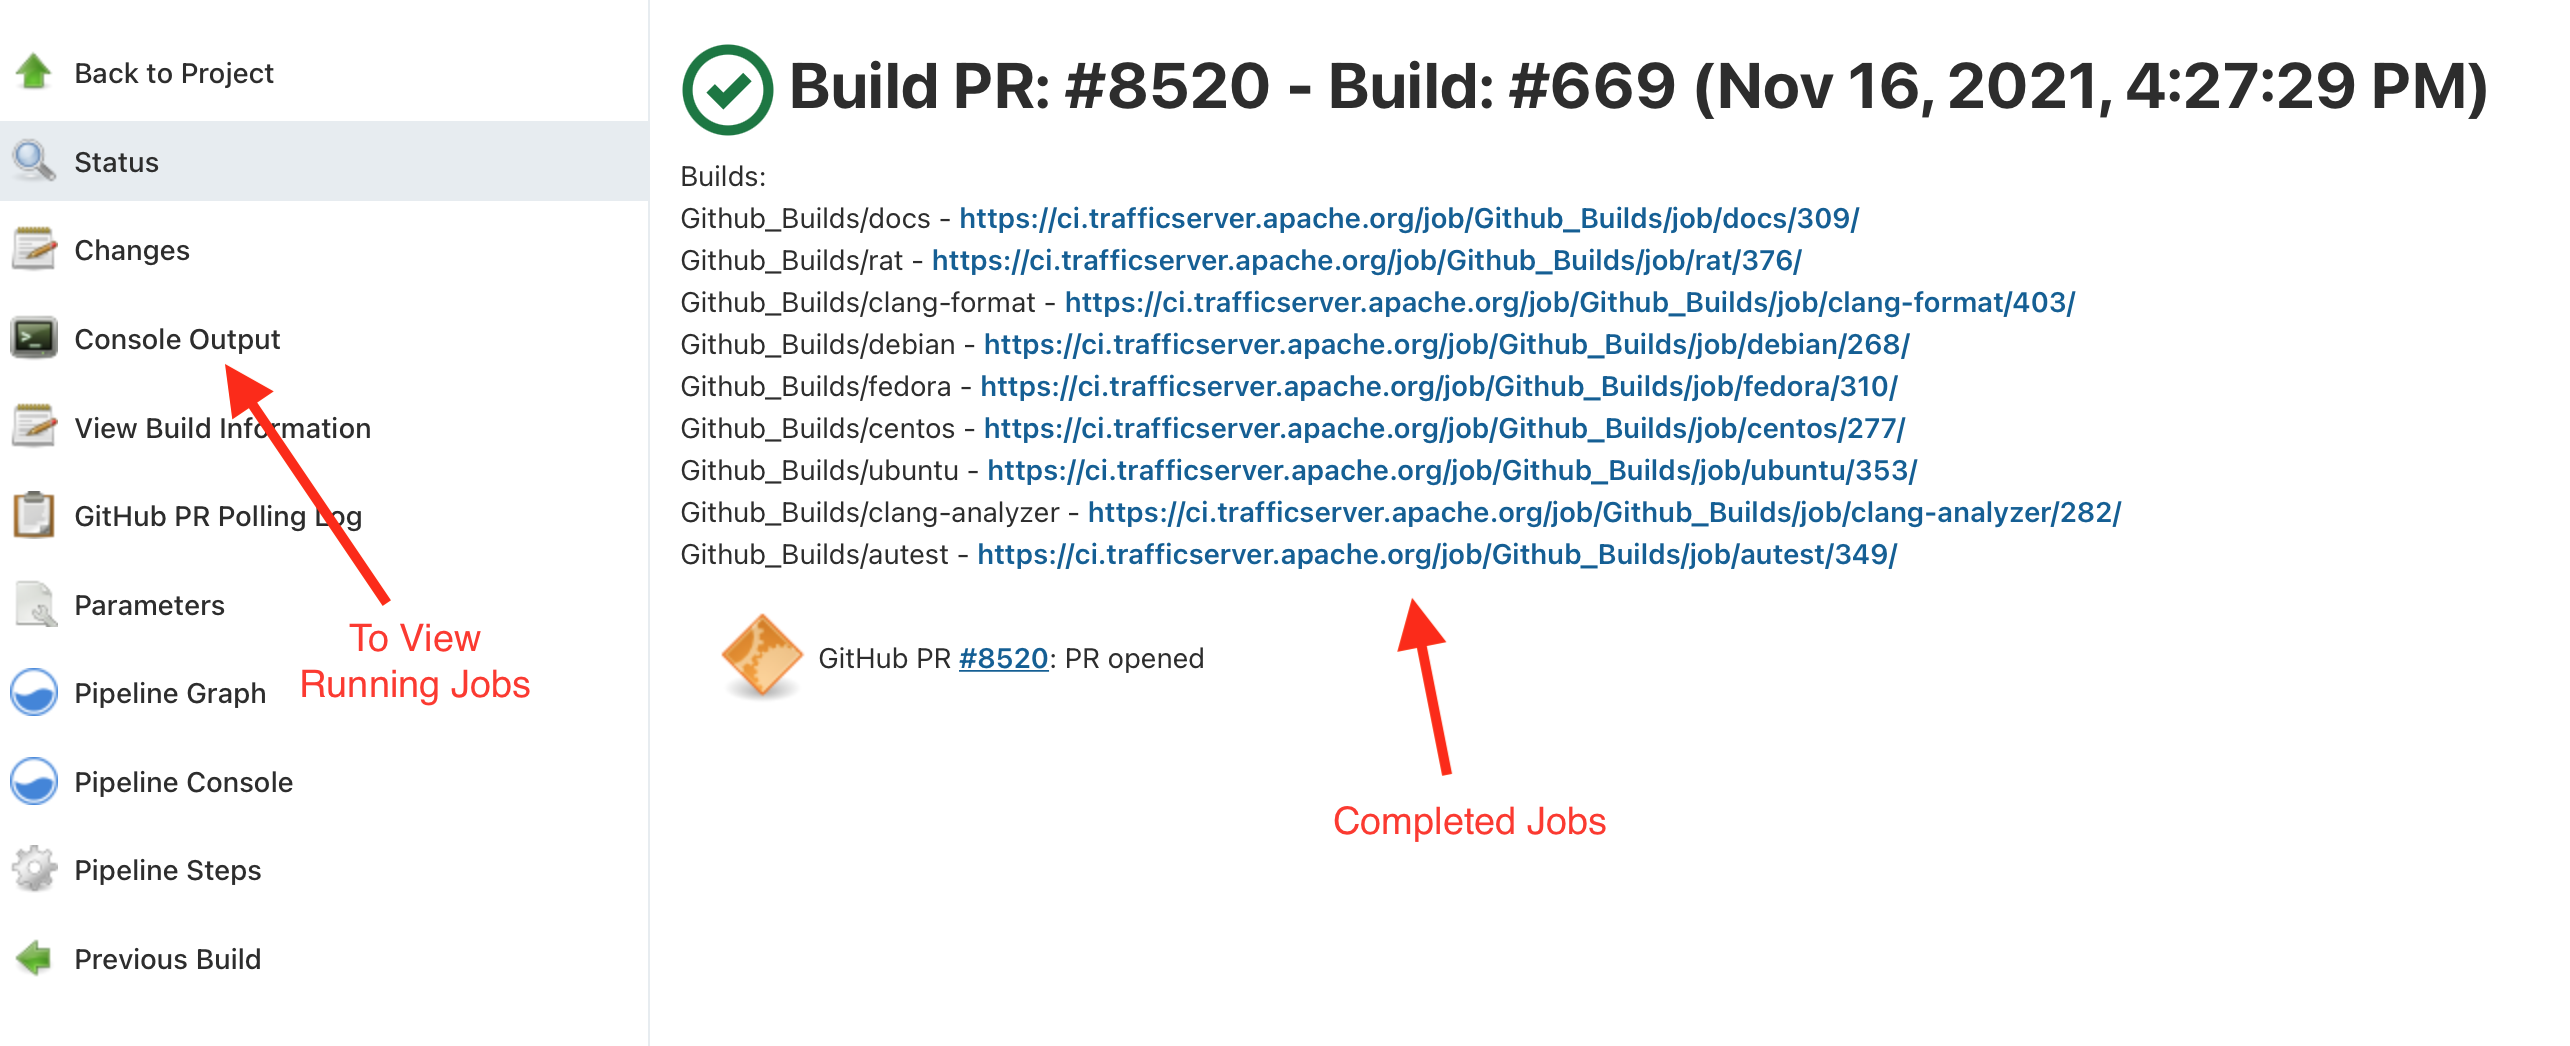
If the CI is failing and you would like to view the details of a failed build, follow the "Details" link on the right side of the Github CI page (see the image above). Following that link will take you to the Pipeline build for your PR. You can then follow the links from the main page of that Pipeline build for all completed builds:
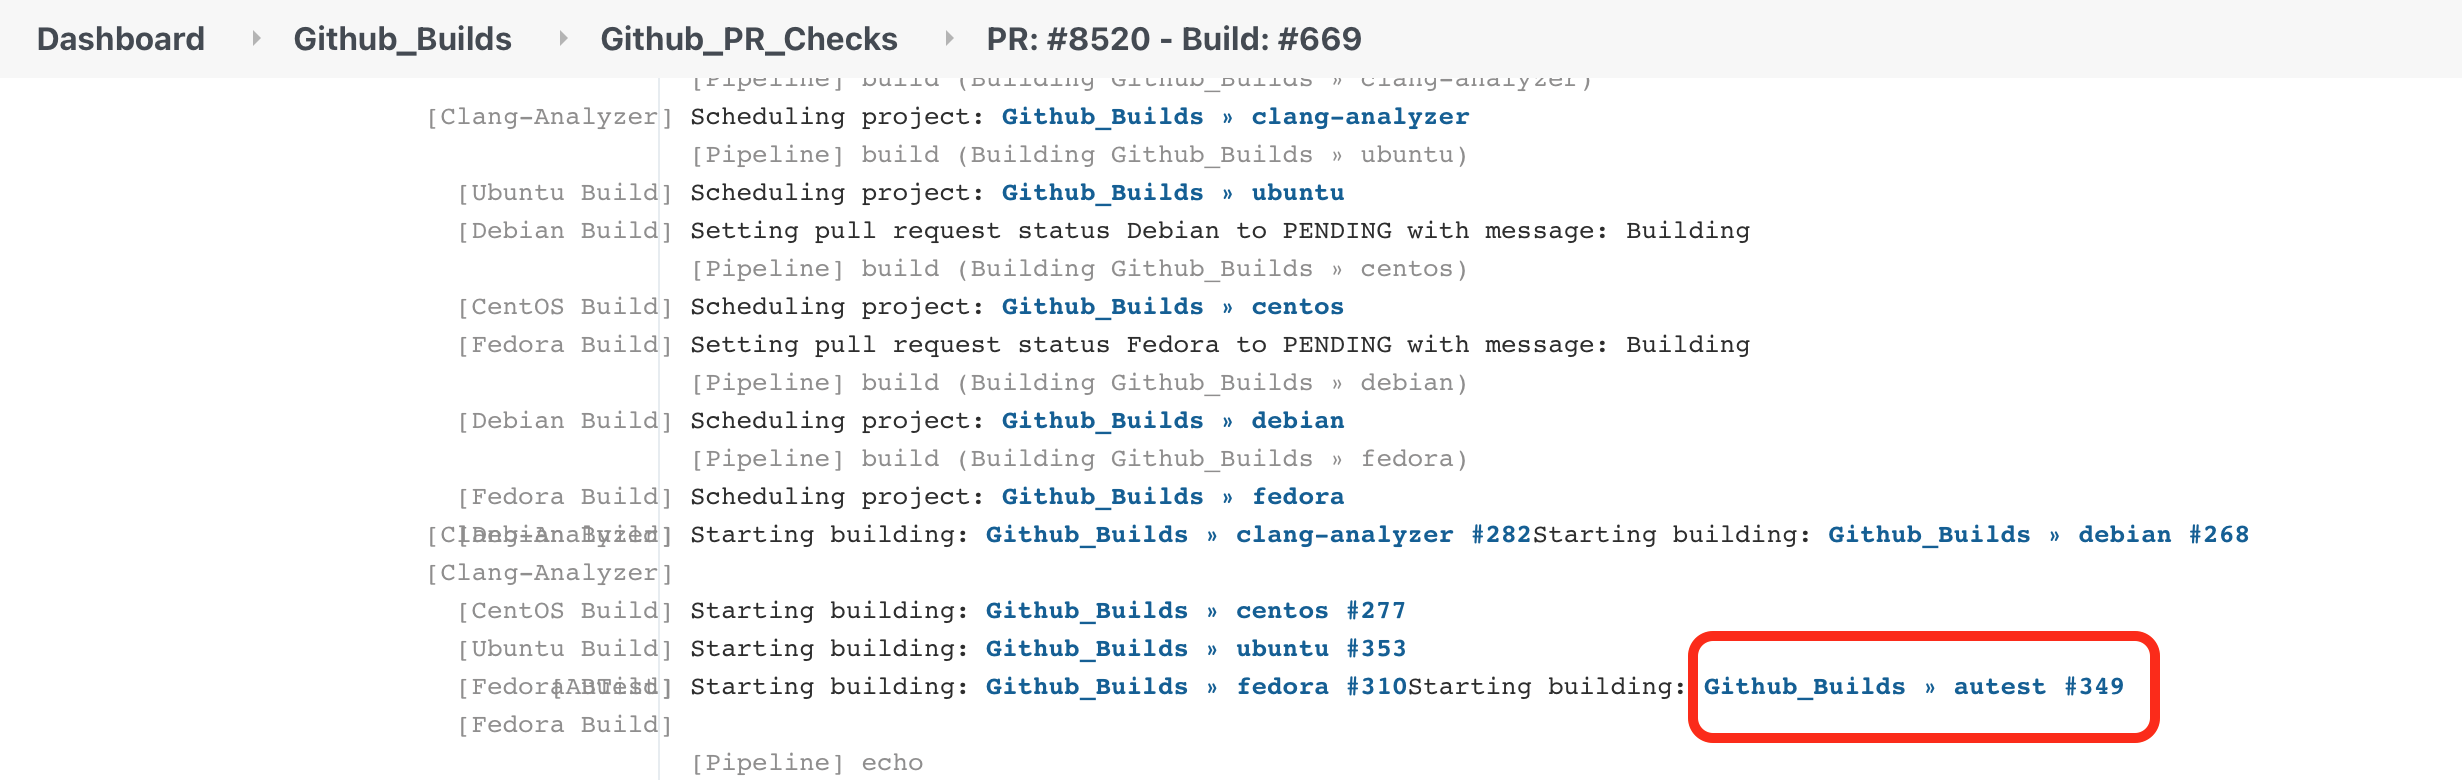
Only builds that have completed will show up on the main page of the Pipeline build. To view running builds, click on the "Console Output" link on the sidebar of the Pipeline. Scroll to the running build of interest and click on that link to access the running build. The following image demonstrates accessing the running autest build from the Console Output of a PR:
Various projects produce build artifacts that can be helpful when reviewing a PR or troubleshooting something that has gone wrong with the CI for the PR. This section describes how to view CI build artifacts.
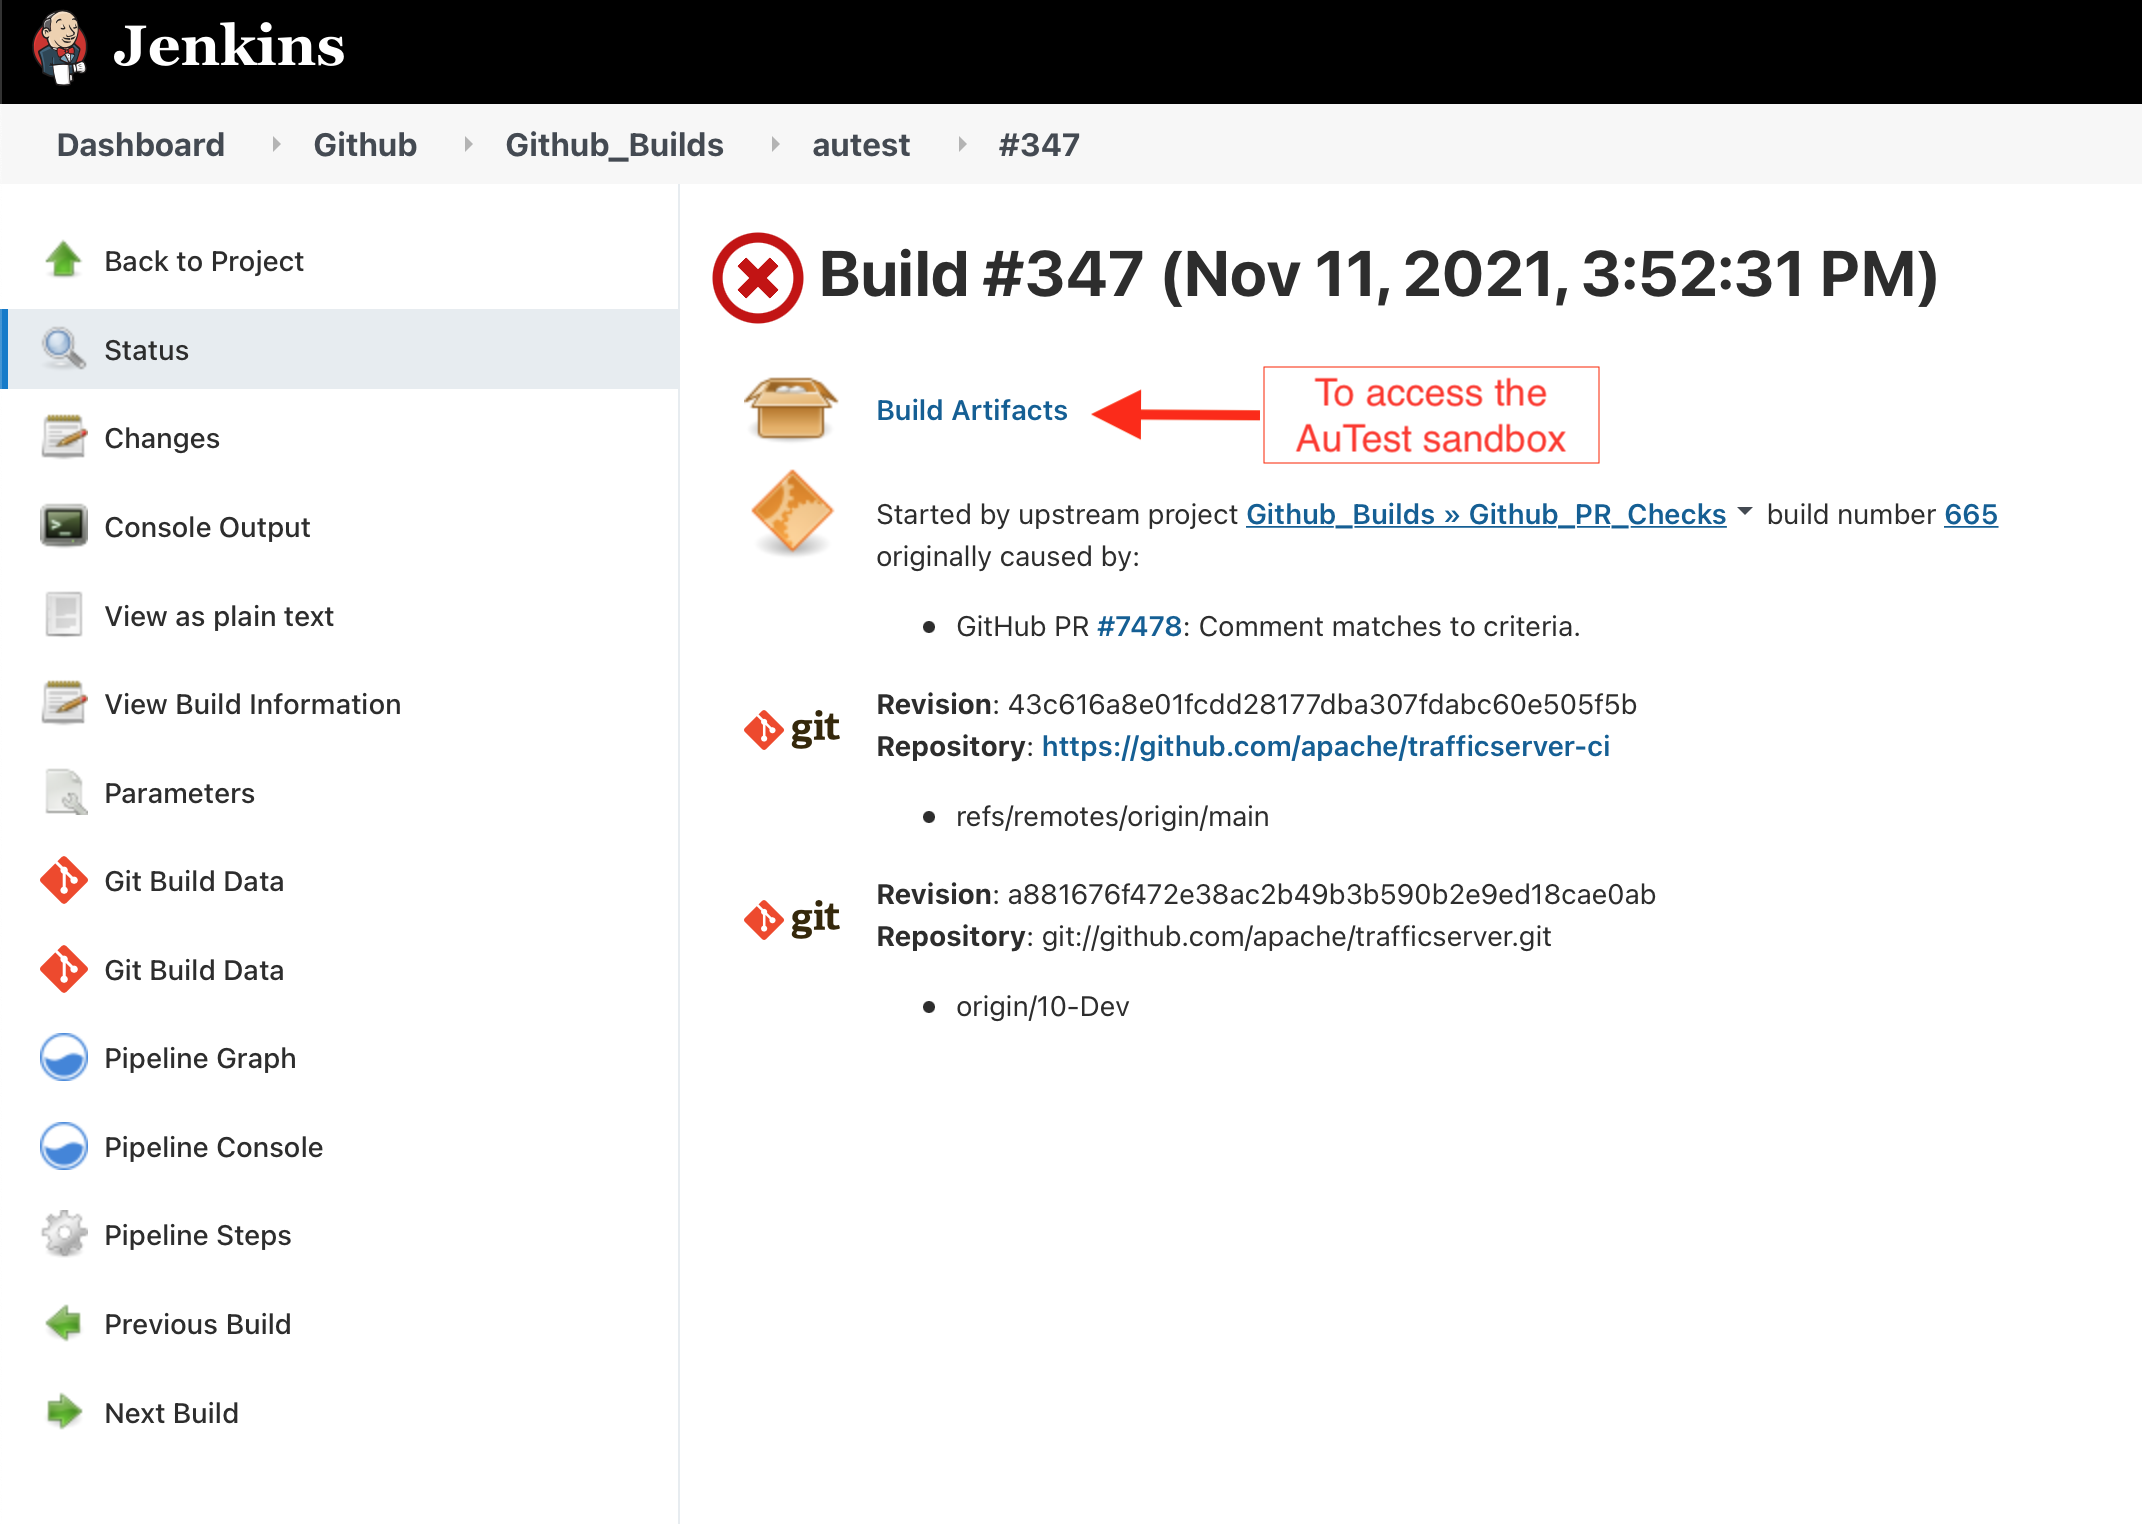
If the autest CI job for a PR has failed, you'll want to first look at the console output for that failed autest build. To navigate to the failed autest build from your Github PR, see the previous section on viewing CI builds. Once you are at the failed CI build, you can view the autest output and its failure messages by following the Console Output link in the side bar. The AuTest sandbox, which has the output of the various processes that make up the failed test and the ATS configuration, can be found by following the "Build Artifacts" link on the autest build page. It will look something like this:
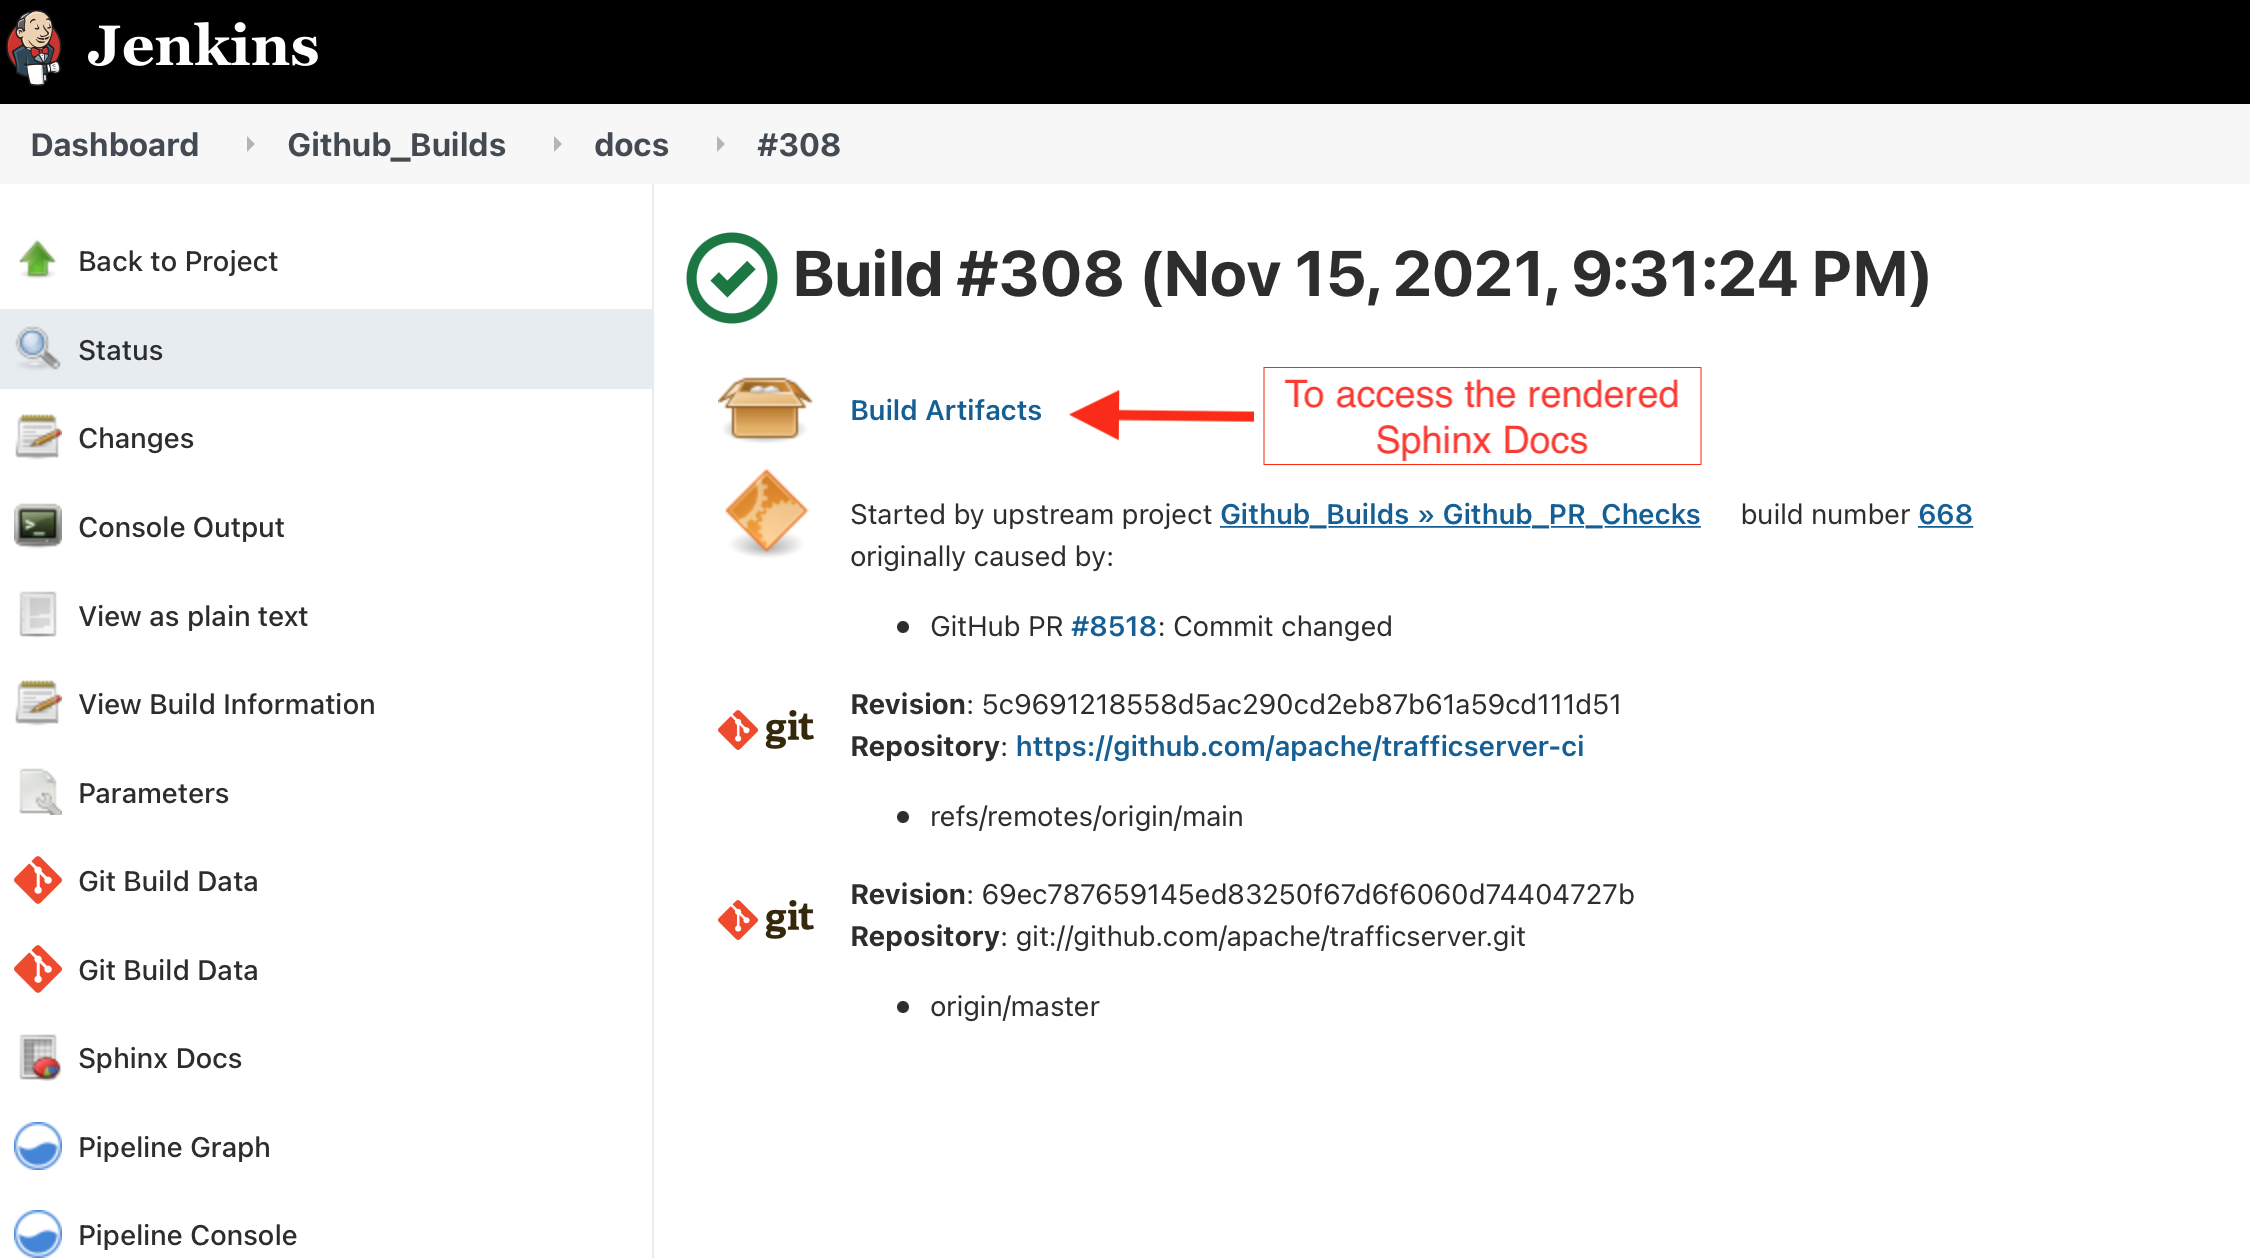
Traffic Server documentation is written and built using the Sphinx framework. Many PRs do not change Traffic Server documentation. For such PRs, the CI docs build do not run, thereby saving CI resources. If the PR does modify the docs, however, then the docs are built via Sphinx. If the build fails, then see the previous section on viewing CI builds to navigate to the docs console output which will contain the Sphinx error. If the build successfully completes, then you or the reviewers of your PR can view the rendered Sphinx HTML docs as a build artifact of the docs build. Navigate to the docs build for your PR and click on the Build Artifacts link:
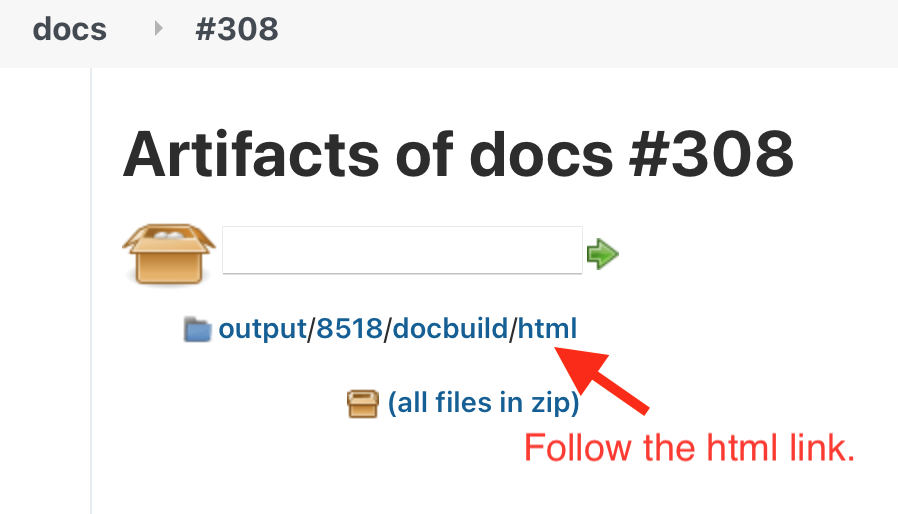
Then follow the html directory in those artifacts:
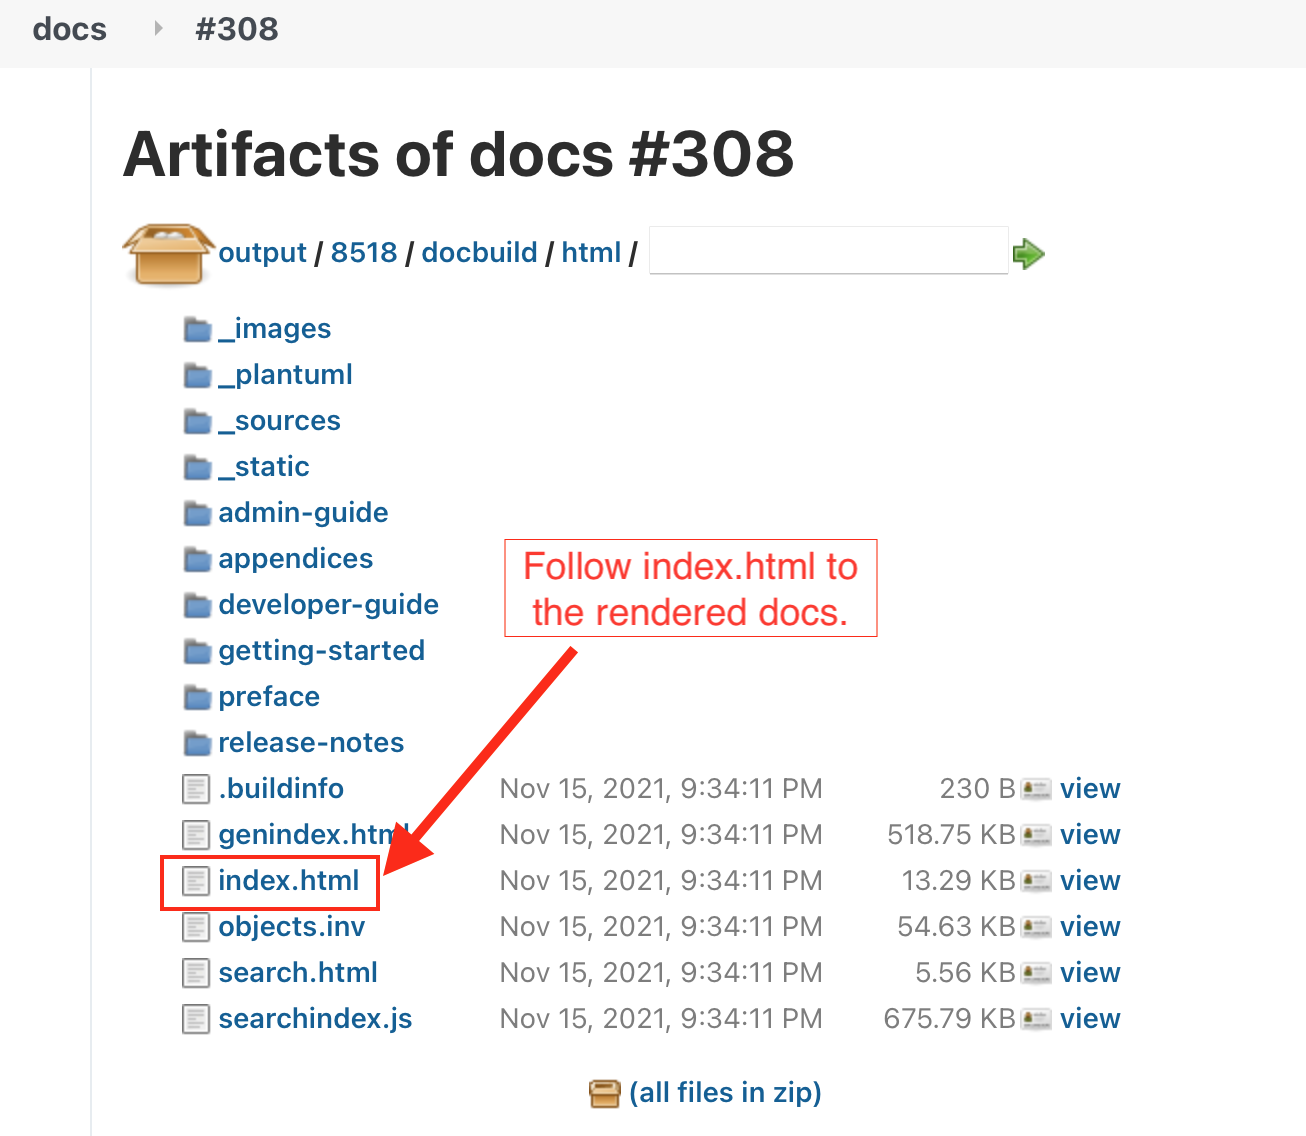
Then have your browser render the docs by clicking on the index.html link:
If a clang-analyzer build fails for a PR, then it generates a report which can be interacted with via your browser. The HTML and supporting resources for that report are exported as a build artifact. Viewing it is very similar to viewing the rendered docs artifacts described above. Navigate to the failed clang-analyzer build from the PR and click on the index.html from the Build Artifacts of the clang-analyzer build.
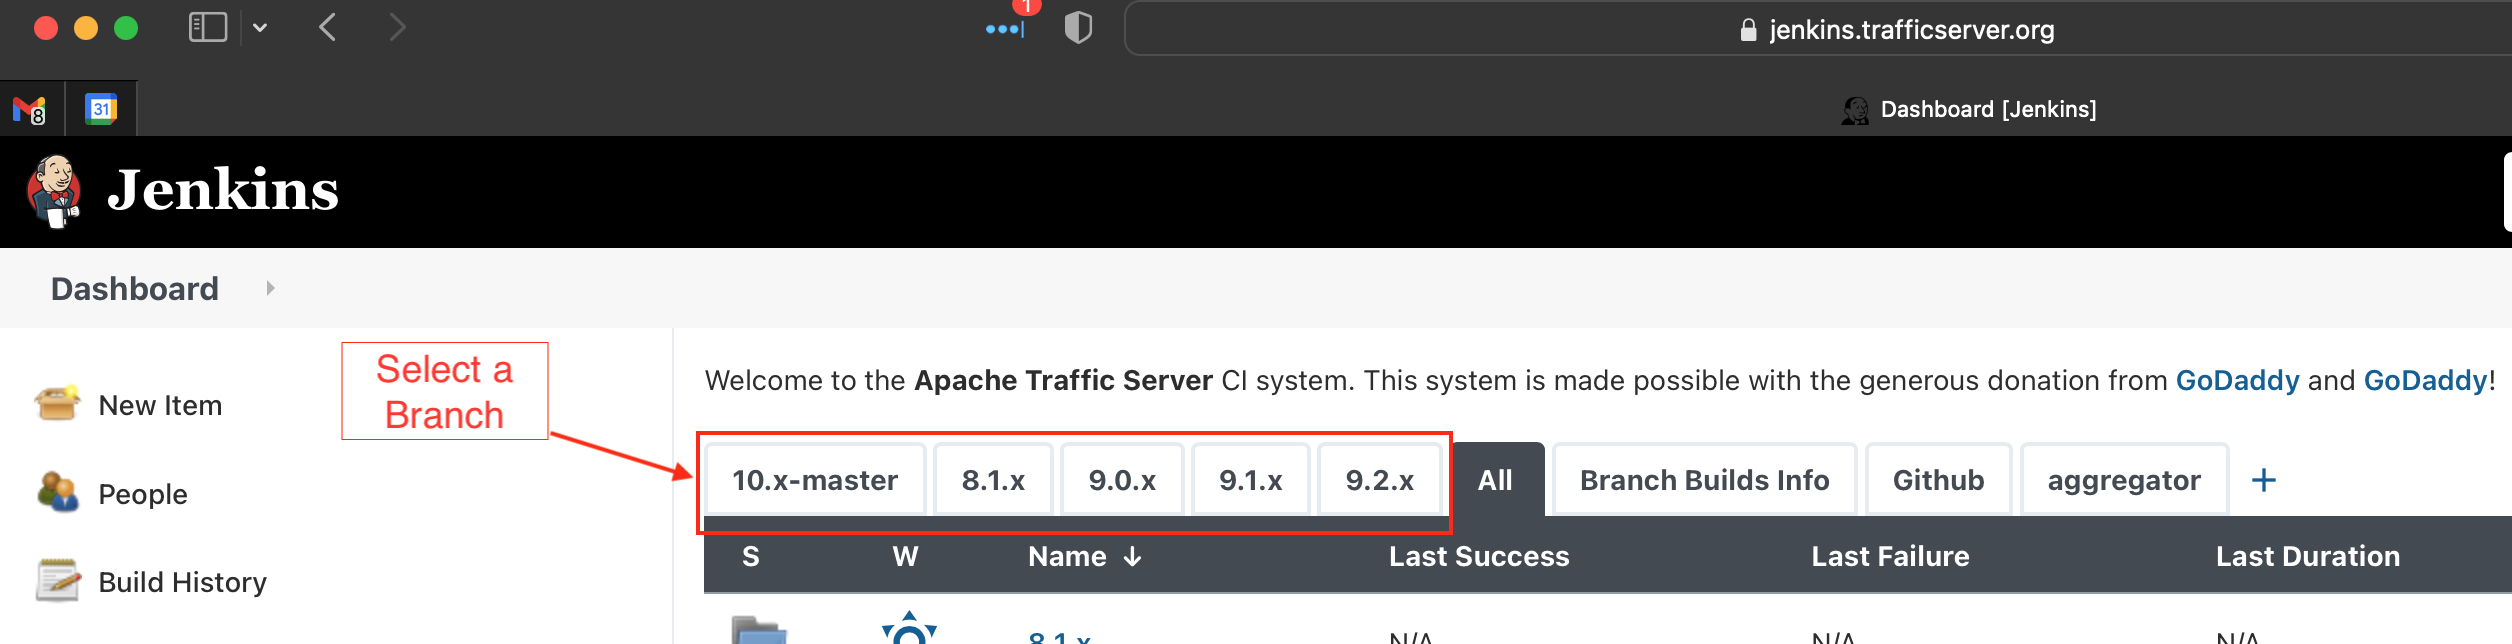
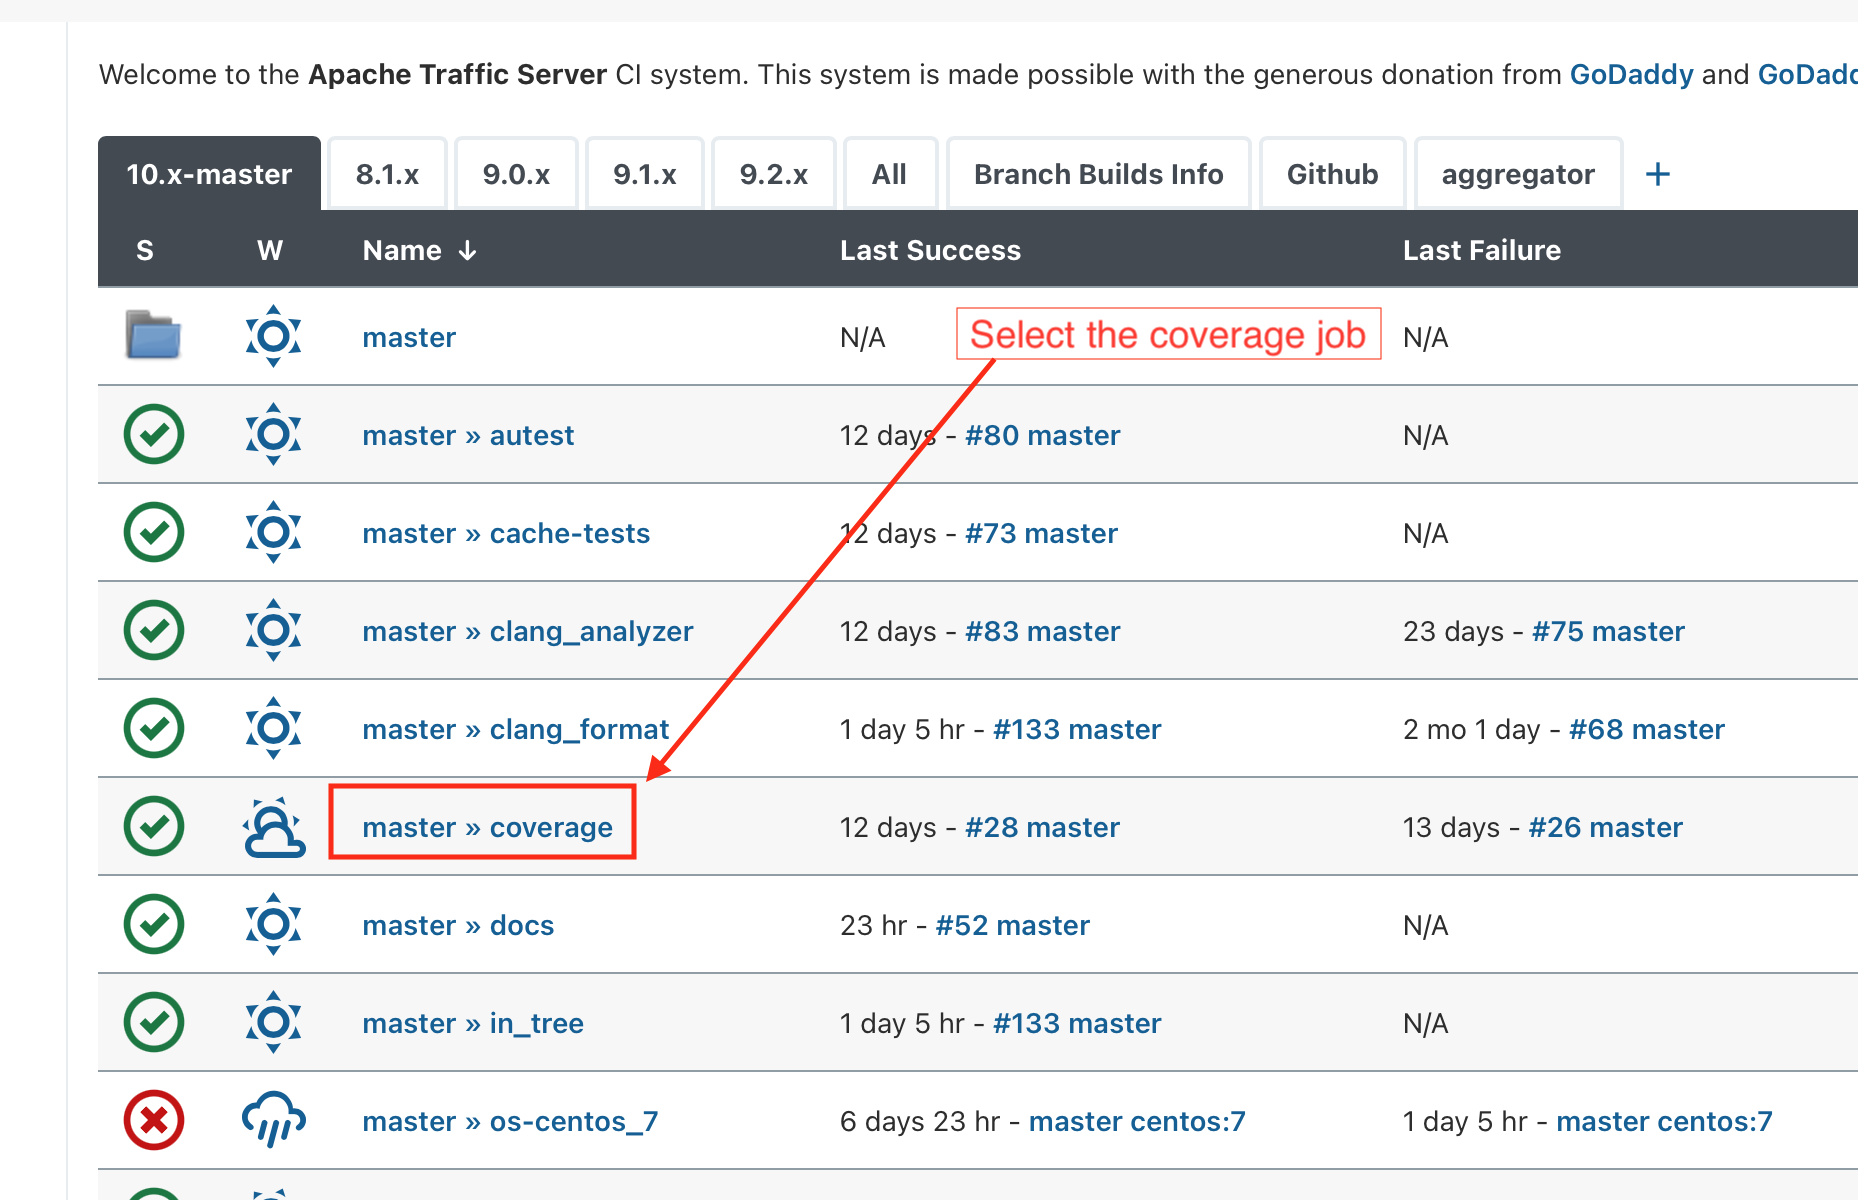
Traffic Server automated tests are made up of Catch unit tests, so-called "regression" integration tests, and end-to-end AuTests. Whenever a change is merged into one of our supported branches (master, 9.2.x, etc.), then CI runs a suite of builds and tests to verify aspects of that branch. One of the outputs of those branch runs is an lcov coverage report which displays test coverage of the various automated tests run in CI. To access the coverage report, navigate to our CI's Jenkins page at https://jenkins.trafficserver.org. Then select the tab for the branch whose test coverage you are interested in:
Then select the coverage project for that branch:
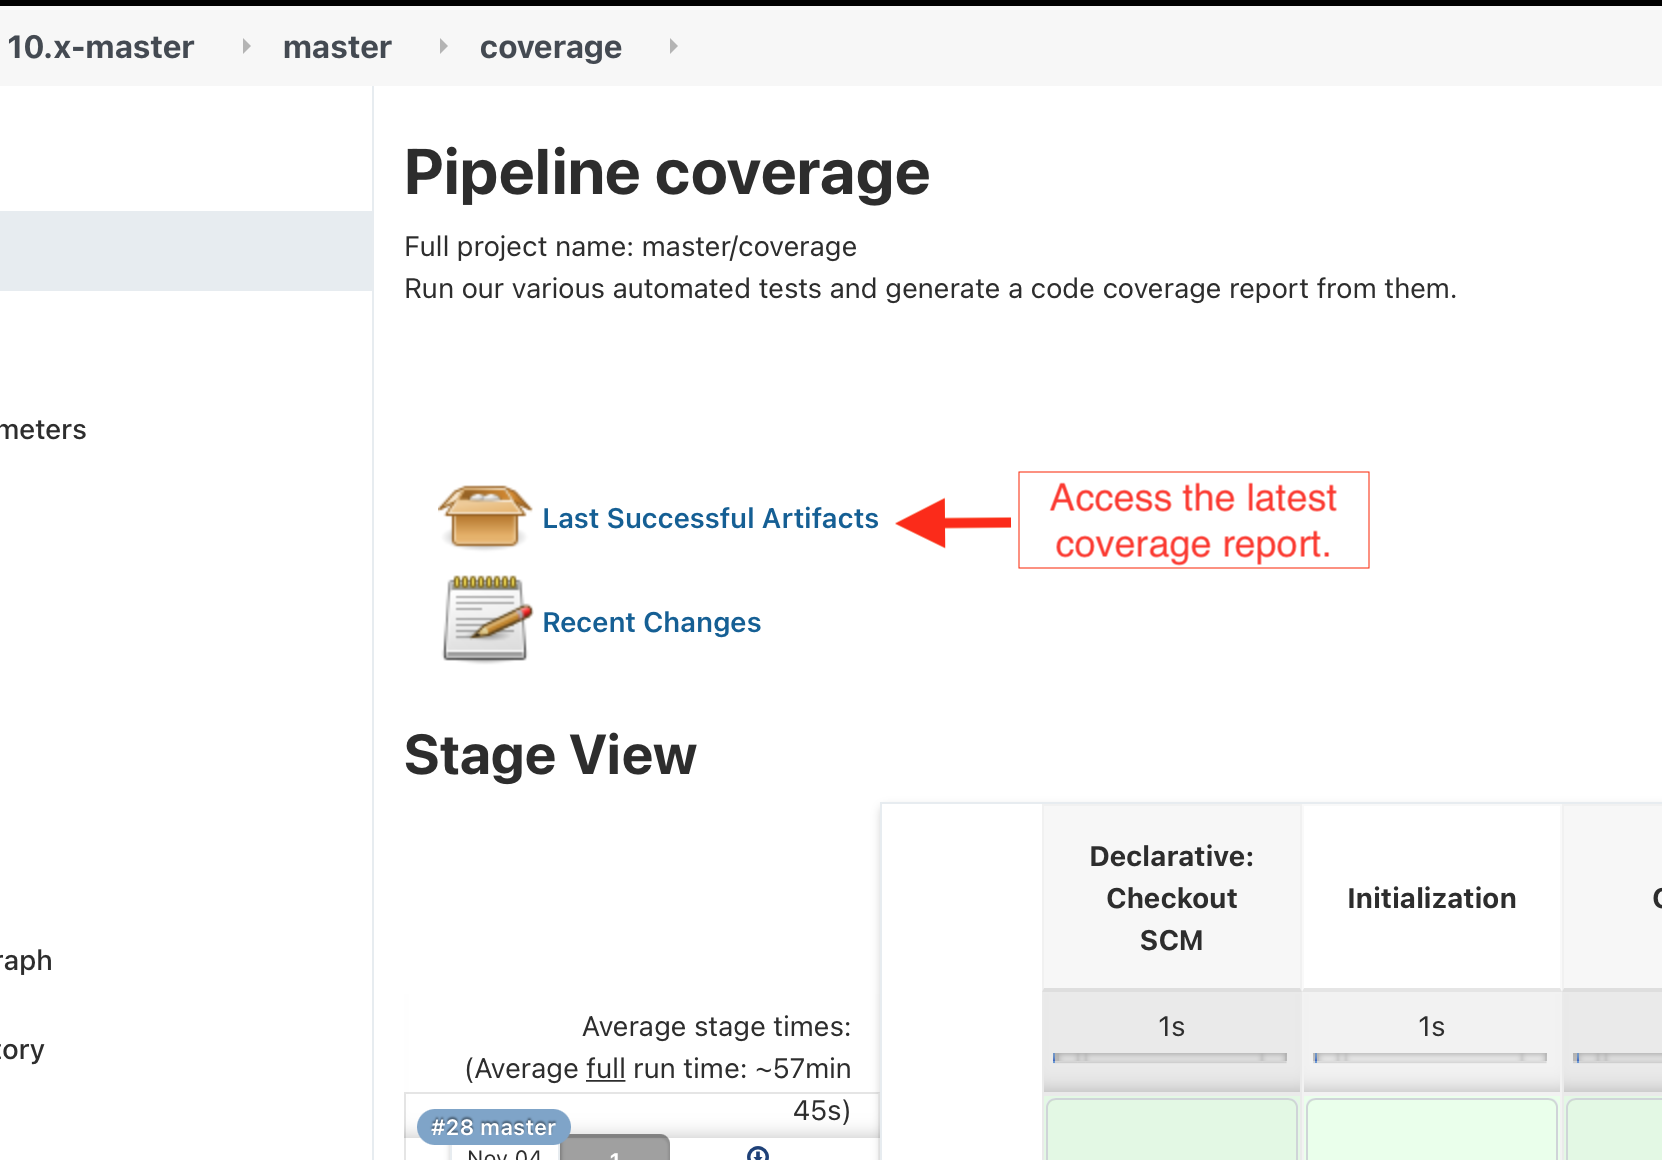
From that coverage project, view the "Last Successful Artifacts":
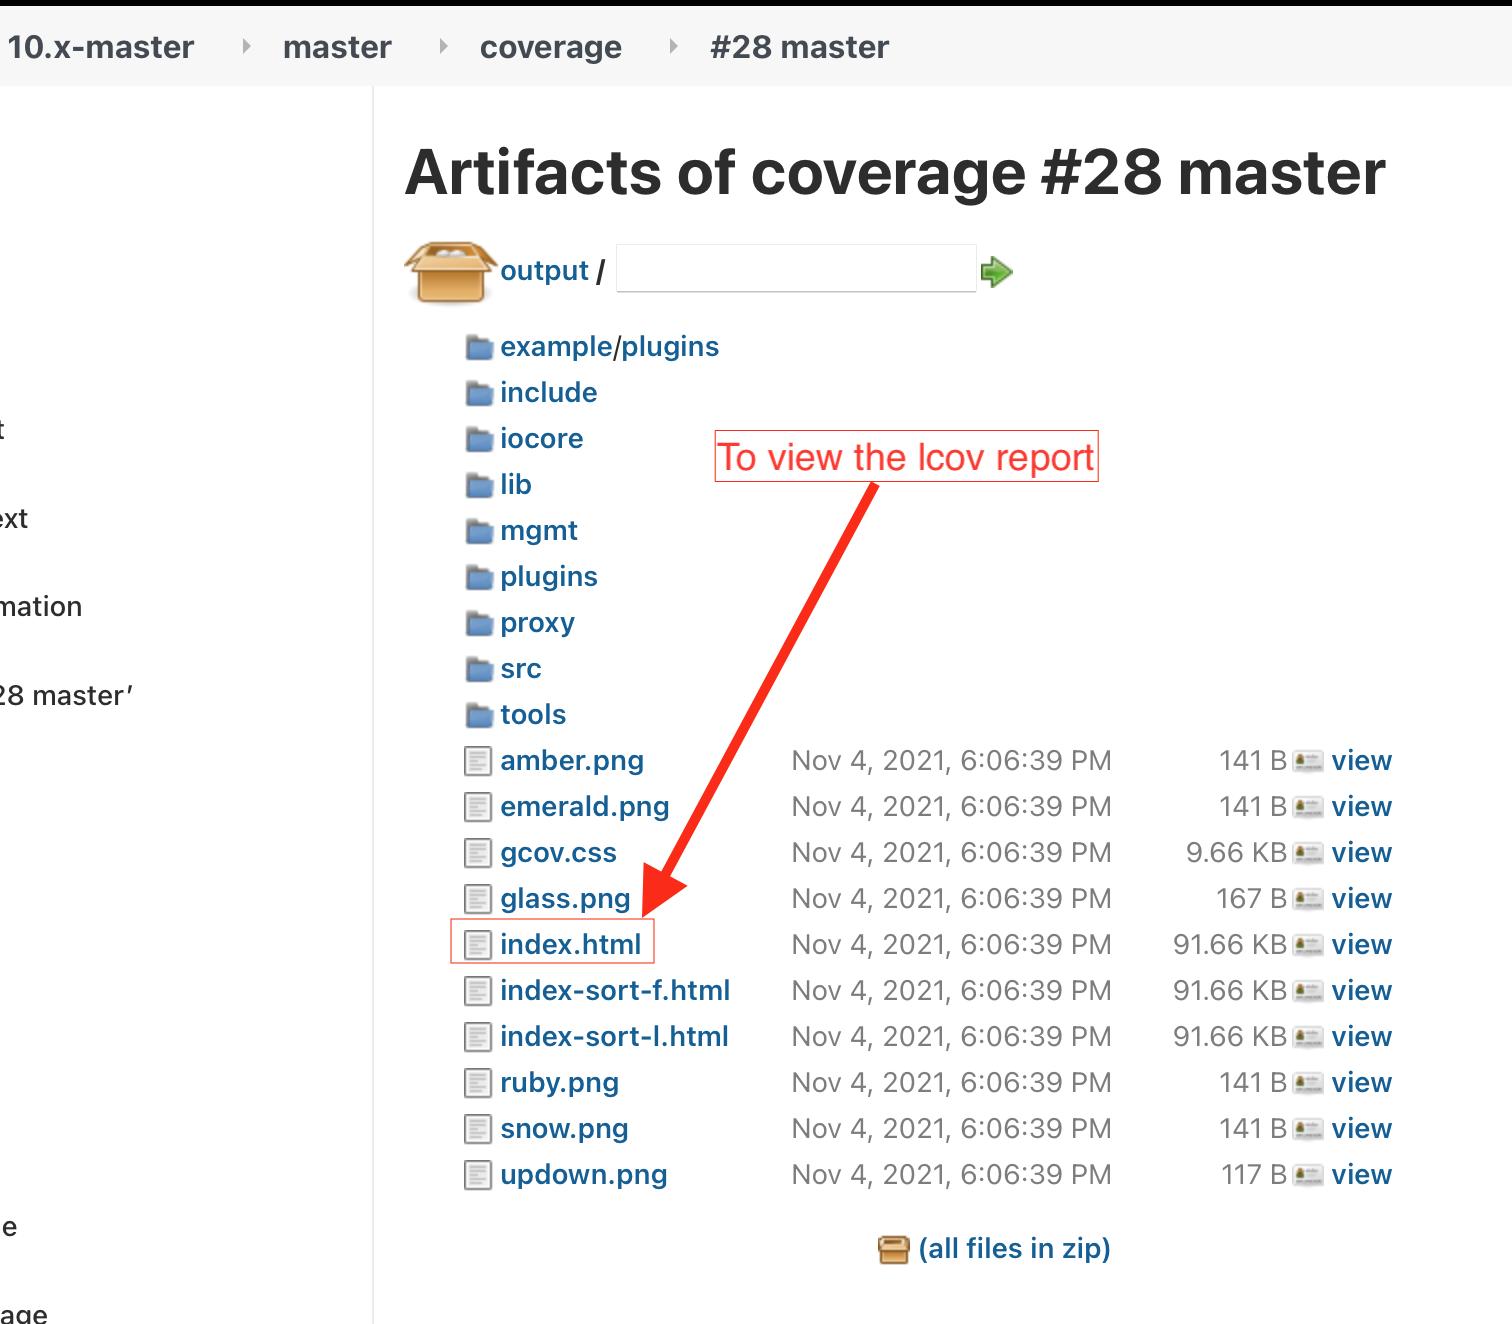
From there, follow the output link and click on the index.html link to view the rendered report:
The docker images used in CI are publicly available. This means that you can run a local autest or docs build, for example, in a container from the same image CI uses. This can be helpful for locally replicating and fixing build issues seen in CI.
# The following steps assume you have docker installed in your system.

# Pull the docker image from CI.
docker pull controller.trafficserver.org/ats/centos:8

# Create and enter a running container for that image.
docker run -it -u 1200:1200 --init --cap-add=SYS_PTRACE --network=host \
   controller.trafficserver.org/ats/centos:8 /bin/bash

# Now, from the bash shell in that container, build Traffic Server:
cd
git clone https://github.com/apache/trafficserver.git
cd trafficserver
autoreconf -fi && ./configure --with-openssl=/opt/openssl-quic --enable-experimental-plugins --enable-example-plugins --prefix=/tmp/ats --enable-werror --enable-debug --enable-wccp --enable-luajit && make -j4 install

# Now run the tests.
cd tests

# Replace <some_test> with the substring for the test, such
# as traffic_dump, or the like:
./autest.sh --ats-bin /tmp/ats/bin/ --sandbox /tmp/sandbox -f <some_test>
The following people developed the Traffic Server CI system (listed in alphabetical order):
- Brian Neradt
- Brian Olsen
- Bryan Call
- Evan Zelkowitz
- Leif Hedstrom
If you have suggestions or there are any issues with the CI (i.e., if CI is unresponsive or down, or a test has started failing unrelated to a change in a PR), please communicate either in Slack via the #traffic-server channel or file an issue describing what is wrong.