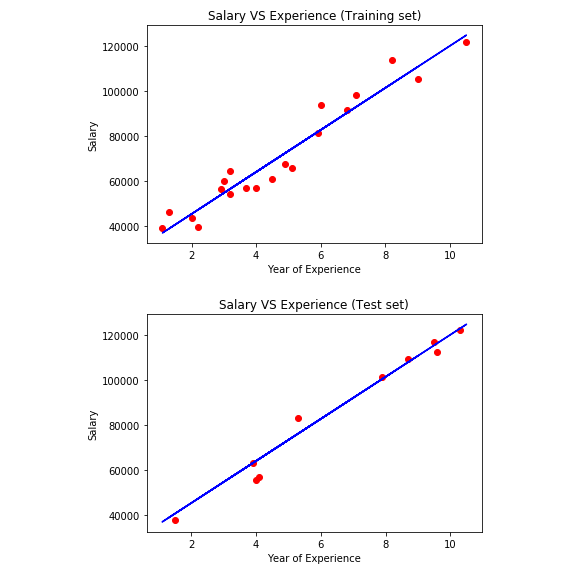
This is a sample use case for predicting salaries based on machine learning via the linear regression model .
- Download the data file entitled salary_data.csv
- Let's look at the dataset and review the columns. In this case we have two columns, years of experience and salary.
Below is the code snippet for loading the data and viewing it via python
import numpy as np
import matplotlib.pyplot as plt
import pandas as pd
dataset = pd.read_csv('...../salary_data.csv')
dataset.head
dataset.describe()
This provides a quick statistical analysis of our dataset. What the count is per column, what is the mean of each column etc.
In this very simple example, no data manipulation is required. However, often there is a need to correct how the dataset is provided. Like removing NaNs or needing to use one hot encoding.
data.isnull().sum()
Now that we have confirmed our dataset is in good standing order, it is time to indicate our X and Y variables by doing the following.
X = dataset['YearsExperience'].values.reshape (-1,1)
y = dataset['Salary'].values.reshape (-1,1)
After identifying our X,Y columns it is time to split our data into training and test data and train our model.
from sklearn.model_selection import train_test_split
X_train, X_test, y_train, y_test = train_test_split(X, y, test_size=1/3, random_state=0)
# Fitting Simple Linear Regression to the Training set
from sklearn.linear_model import LinearRegression
regressor = LinearRegression()
regressor.fit(X_train, y_train)
#Step Four We can now visualize our our training and test datasets using matplotlib
# Visualizing the Training set results
viz_train = plt
viz_train.scatter(X_train, y_train, color='red')
viz_train.plot(X_train, regressor.predict(X_train), color='blue')
viz_train.title('Salary VS Experience (Training set)')
viz_train.xlabel('Year of Experience')
viz_train.ylabel('Salary')
viz_train.show()

# Visualizing the Test set results
viz_test = plt
viz_test.scatter(X_test, y_test, color='red')
viz_test.plot(X_train, regressor.predict(X_train), color='blue')
viz_test.title('Salary VS Experience (Test set)')
viz_test.xlabel('Year of Experience')
viz_test.ylabel('Salary')
viz_test.show()
It is time to start making some predictions! Make a new prediction based on five year experience with the following:
y_pred = regressor.predict([[5.0]])
print(y_pred)
To test how well this model is accurately predicting based on the actuals, we will want to check the root of the mean square error, as well review the test score to see how well the model is performing.
regressor.score(X_test, y_test)

