-
Notifications
You must be signed in to change notification settings - Fork 0
Description of Support
(Temporal) relationships between variables may be obscured or distorted when viewed with different connections between the spatial units. The change of support (COS) problem is concerned with inference about the values of the variables at supports different from at which it has been observed. The term “support” has come to mean simply the size or volume associated with each data value, but the complete specification of this term also includes the geometrical size, shape, and spatial orientation of the regions associated with the measurements.
Question to be answered: What was the change of support A (t) -> A (t + dt) for all t
Set of polygons having the attributes
[mandatory]: ID
[mandatory]: geometry
[mandatory]: time stamp
[optional]: predecessors
[optional]: data value
[optional]: thematic attribute
[optional]: Function which determines the predecessor
Reference time stamp is always the first layer, change is determined according to the sorting of the polygons, default sorting is time stamp ascending.
If predecessors are not defined, generate them, else use the values provided in the input. Default method to determine predecessor is spatial overlap.
If data values or thematic attributes are set, they will be considered in the step for creating links (e.g. use only polygons with class "water" to generate links).
| ID | Geometry | Time Stamp | Predecessors (optional) | Data Value (optional) | Thematic Attribute (optional) |
|---|---|---|---|---|---|
| 1 | geom | t_1 | - | 3.14 | "Water" |
| 2 | geom | t_2 | 1 | 1337 | "Water" |
| 3 | geom | t_2 | 1 | 666 | "Forest" |
| 4 | geom | t_3 | 2,3 | 1234 | "Water" |
Possibilities of qualitative COS:
Describing the process, which generates the polygon.
- Split
- Merge
- Dissolve/Annihilation
- Stable
Possibilities of quantitative COS:
Geometric:
	- area
	- compactness
	- circumference
Topologic:
	- orientation
If column predecessors are not populated in the input, it will be added.
| ID | Geometry | Time Stamp | Predecessors | Data Value (optional) | Thematic Attribute (optional) | Qualitative Change of Support | Quantitative Change of Support |
|---|---|---|---|---|---|---|---|
| 1 | geom | t_1 | - | 3.14 | "Water" | - | {overall_variability: 0.3} |
| 2 | geom | t_2 | 1 | 1337 | "Water" | Split | {"area":{"increase", "5%", 235},"compactness":{"decrease", "3%", 0.1}, ...} |
| 3 | geom | t_2 | 1 | 666 | "Forest" | Split | |
| 4 | geom | t_3 | 2,3 | 1234 | "Water" | Merge |
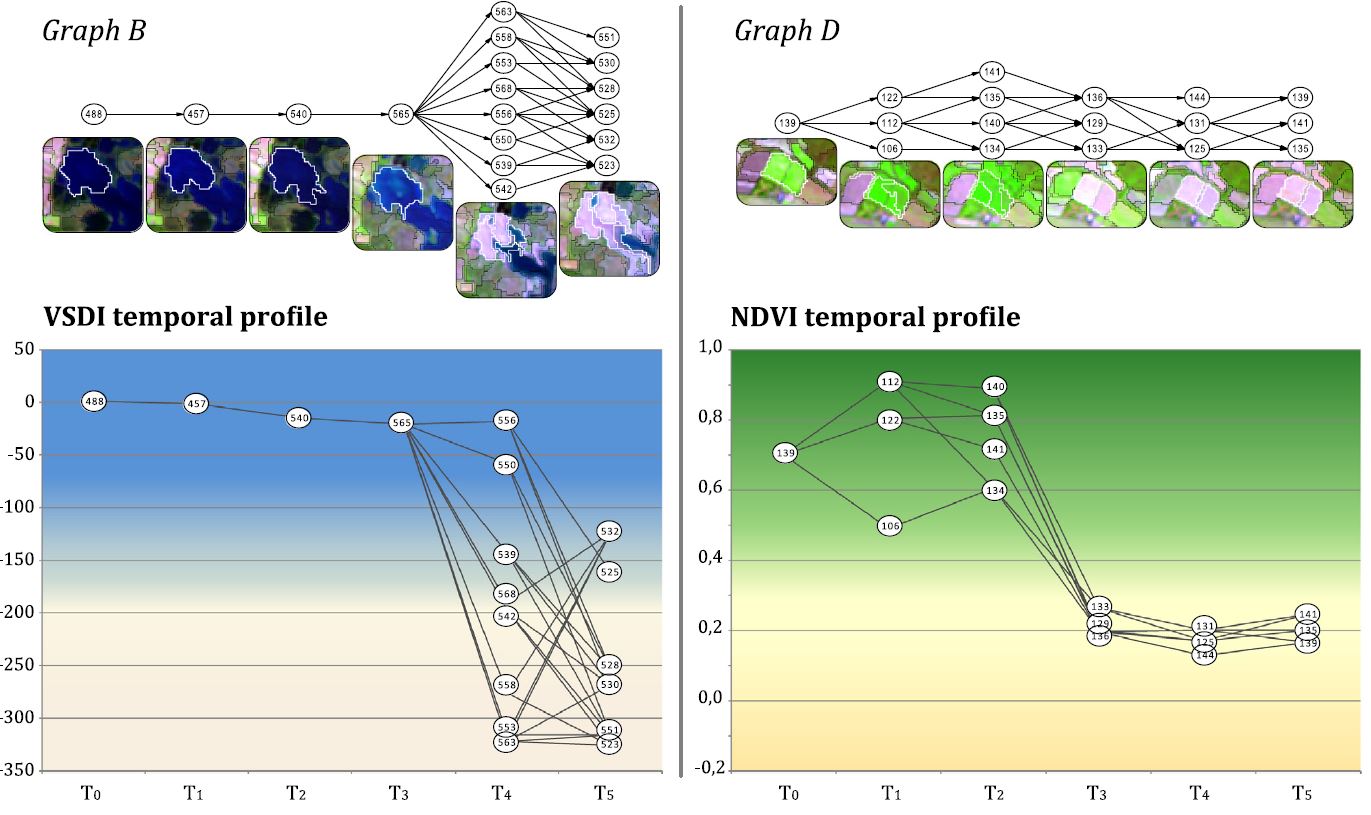
Example visualisation (from Guttler, Fabio; Ienco, Dino; Nin, Jordi; Teisseire, Maguelonne; Poncelet, Pascal (2017): A graph-based approach to detect spatiotemporal dynamics in satellite image time series. In ISPRS Journal of Photogrammetry and Remote Sensing 130, pp. 92–107. DOI: 10.1016/j.isprsjprs.2017.05.013).
