A Python implementation of Baffling Recursive Algorithm for Isotopic distributioN calculations (BRAIN).
This is a direct translation of Han Hu's root-finding-free approach.
Documentation: http://mobiusklein.github.io/brainpy
Theoretical isotopic patterns appear when you can resolve distinct isotopes of an ion in a mass spectrum. Being able to predict the isotopic pattern of a molecule is useful for interpreting mass spectra to avoid counting the same ion with extra neutrons twice, recognizing the monoisotopic peak of a large multiply charged ion, or for discriminating among different elemental compositions of similar masses.
BRAIN takes an elemental composition represented by any Mapping-like Python object
and uses it to compute its aggregated isotopic distribution. All isotopic variants of the same
number of neutrons are collapsed into a single centroid peak, meaning it does not consider
isotopic fine structure.
from brainpy import isotopic_variants

# Generate theoretical isotopic pattern
peptide = {'H': 53, 'C': 34, 'O': 15, 'N': 7}
theoretical_isotopic_cluster = isotopic_variants(peptide, npeaks=5, charge=1)
for peak in theoretical_isotopic_cluster:
    print(peak.mz, peak.intensity)

# produce a theoretical profile using a gaussian peak shape
import numpy as np
mz_grid = np.arange(theoretical_isotopic_cluster[0].mz - 1,
                    theoretical_isotopic_cluster[-1].mz + 1, 0.02)
intensity = np.zeros_like(mz_grid)
sigma = 0.002
for peak in theoretical_isotopic_cluster:
    # Add gaussian peak shape centered around each theoretical peak
    intensity += peak.intensity * np.exp(-(mz_grid - peak.mz) ** 2 / (2 * sigma)
            ) / (np.sqrt(2 * np.pi) * sigma)

# Normalize profile to 0-100
intensity = (intensity / intensity.max()) * 100

# draw the profile
from matplotlib import pyplot as plt
plt.plot(mz_grid, intensity)
plt.xlabel("m/z")
plt.ylabel("Relative intensity")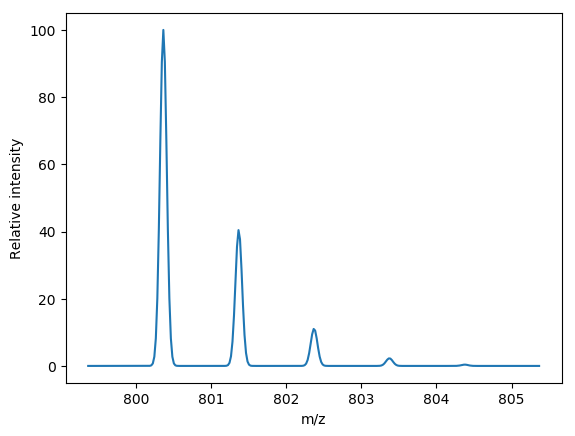
P. Dittwald, J. Claesen, T. Burzykowski, D. Valkenborg, and A. Gambin, “BRAIN: a universal tool for high-throughput calculations of the isotopic distribution for mass spectrometry.,” Anal. Chem., vol. 85, no. 4, pp. 1991–4, Feb. 2013.
H. Hu, P. Dittwald, J. Zaia, and D. Valkenborg, “Comment on ‘Computation of isotopic peak center-mass distribution by fourier transform’.,” Anal. Chem., vol. 85, no. 24, pp. 12189–92, Dec. 2013.