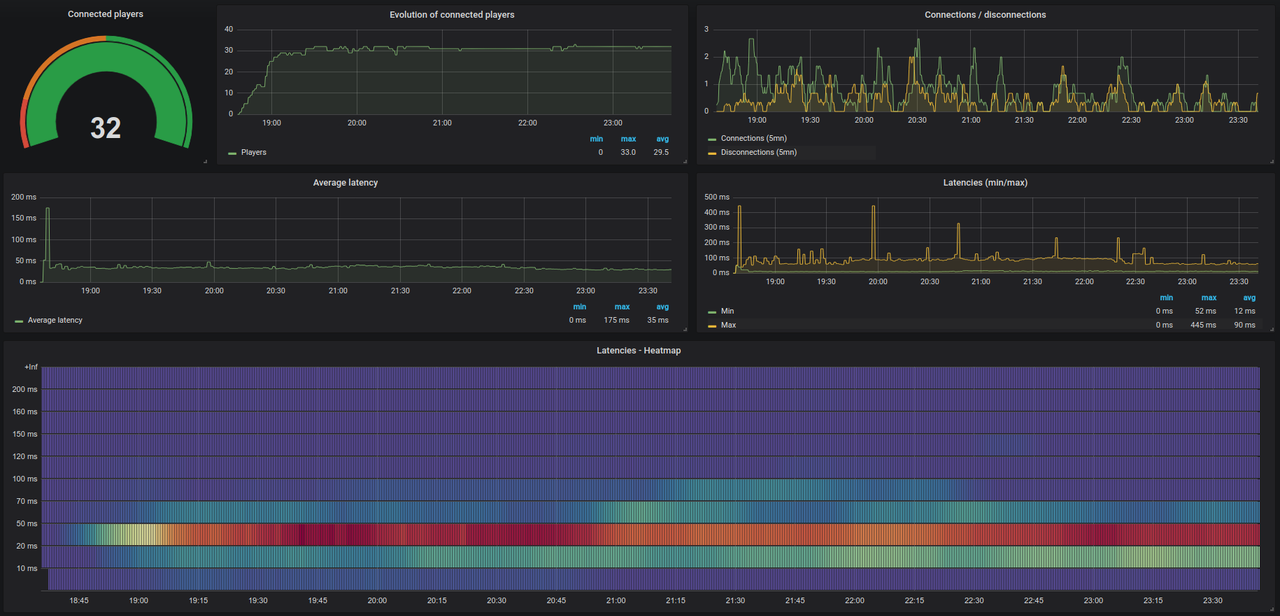
This resource adds a Prometheus endpoint to your FX Server.
There are some default metrics available and you can add yours.
| Name | Type | Description |
|---|---|---|
| fxs_player_count | Gauge | Number of connected players |
| fxs_player_connections | Counter | Number of player connections |
| fxs_player_disconnections | Counter | Number of player disconnections |
| fxs_average_player_latency | Gauge | Average player latency |
| fxs_players_latency | Histogram | Players latency |
| fxs_min_player_ping | Gauge | Minimum player ping |
| fxs_max_player_ping | Gauge | Maximum player ping |
Convars available:
| Name | Type | Default value | Description |
|---|---|---|---|
| prometheus_timeout | int | 5000 | Interval in ms to collect data |
| prometheus_auth_enabled | int | 0 | Protects the endpoint with credentials if true (1) |
| prometheus_login | string | "admin" | Endpoint login |
| prometheus_password | string | "admin" | Endpoint password |
# A scrape configuration containing exactly one FXS endpoint to scrape.
scrape_configs:
  - job_name: 'fxserver'
    scrape_interval: 60s
    basic_auth:
      username: admin
      password: admin
    metrics_path: /prometheus/metrics
    static_configs:
      - targets: ['127.0.0.1:30120']
--[[
 * @event prometheus:addMetric
 *
 * @param {string} type - The metric type, i.e. Gauge.
 * @param {string} name - The metric name.
 * @param {string} description - The metric description.
 * @param {function} cb - A callback function to update the metric with a method name (i.e. set) and a value.
]]
TriggerEvent("prometheus:addMetric", "Gauge", "fxs_gauge_example", "Gauge example.", function(cb)
    math.randomseed(os.clock())
    if math.random(0, 1) == 1 then
      cb("set", 42)
    else
      cb("set", 1664)
    end
end)