


ℹ️ Created in 2016 by Pierre Raybaut and maintained by the PlotPyStack organization.
ℹ️ PlotPy V2 is the new major release of guiqwt: same team 🏋️, same goal 🎯, same long-term support ⏳.
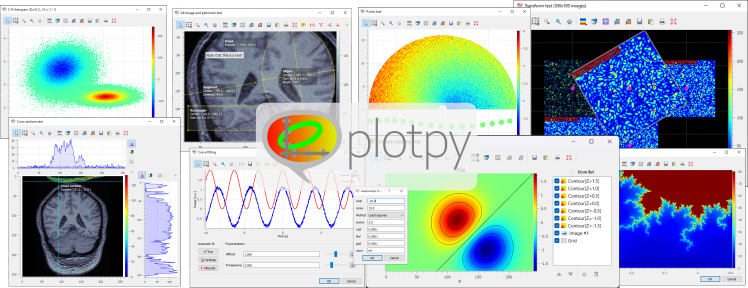
plotpy is is a Python library providing efficient 2D data-plotting features
for interactive computing and signal/image processing application development.
It is part of the PlotPyStack project, aiming at
providing a unified framework for creating scientific GUIs with Python and Qt.
plotpy is based on:
- Python language and Qt GUI toolkit (via PySide or PyQt)
- guidata automatic GUI generation library
- PythonQwt plotting widgets library
- NumPy and SciPy scientific computing libraries
See documentation for more details on the library and changelog for recent history of changes.
Copyrights and licensing:
- Copyright © 2023 CEA, Codra, Pierre Raybaut.
- Licensed under the terms of the BSD 3-Clause (see LICENSE).
The plotpy library also provides the following features.
General plotting features:
- Ready-to-use plot widgets and dialog boxes
- pyplot: interactive
plotting widgets, equivalent to
matplotlib.pyplot, at least for the implemented functions - Supported plot items: curves, images, contours, histograms, labels, shapes, annotations, ...
Interactive features (i.e. not only programmatic plotting but also with mouse/keyboard):
- Multiple object selection for moving objects or editing their properties through automatically generated dialog boxes
- Item list panel: move objects from foreground to background, show/hide objects, remove objects, ...
- Customizable aspect ratio for images
- Tons of ready-to-use tools: plot canvas export to image file, image snapshot, interval selection, image rectangular filter, etc.
- Curve fitting tool with automatic fit, manual fit with sliders, ...
- Contrast adjustment panel for images: select the LUT by moving a range selection object on the image levels histogram, eliminate outliers, ...
- X-axis and Y-axis cross-sections: support for multiple images, average cross-section tool on a rectangular area, ...
- Apply any affine transform to displayed images in real-time (rotation, magnification, translation, horizontal/vertical flip, ...)
Application development helpers:
- Ready-to-use plot widgets and dialog boxes
- Load/save graphical objects (curves, images, shapes) into HDF5, JSON or INI files
- A lot of test scripts which demonstrate
plotpyfeatures (see examples)
See Installation section in the documentation for more details.