

Key Features • How To Use • Download • Running extension •
- Import supported pyodide on the fly
- Support for extending dev panel to tab
- Report View for Graph Representation and Custom Html
- Download Report as PDF
- Python Console right in your dev panel or tab
- Search Support For Editor
- Python available offline
- Packages available for download to disk cache packages
Pull from master for release . To get development pull from develop branch
- Installing
npm install - For building
npm run build - Running
npm run start
- Build app
- Go to chrome -> Extension -> Developer Mode ON -> Load unpacked(/repo/pkg)
- open devtools , you should be able to see the Editor
These Function enable let you to write html , css , add javascript and download data
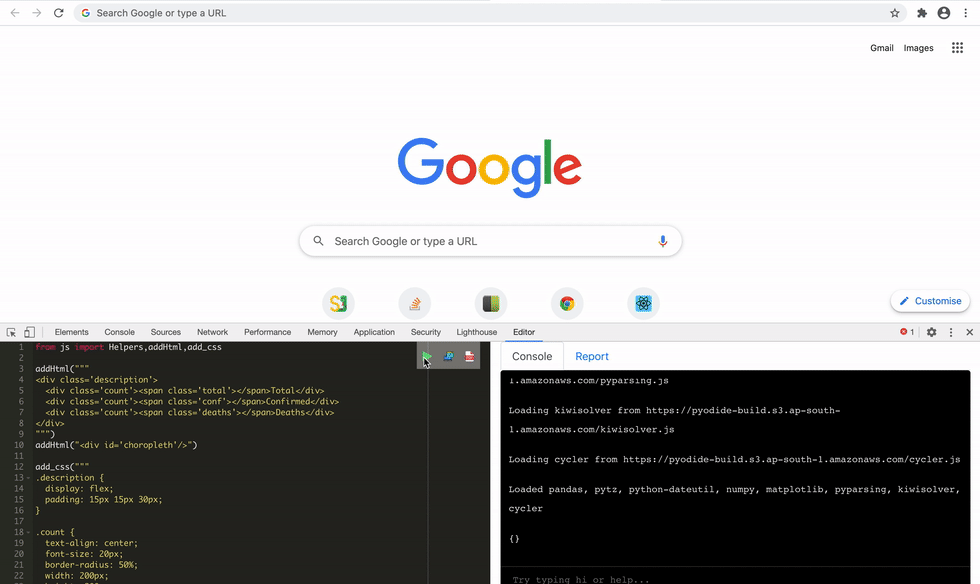
from js import Helpers,addHtml,add_css

addHtml("""
<div class='description'>
  <div class='count'><span class='total'></span>Total</div>
  <div class='count'><span class='conf'></span>Confirmed</div>
  <div class='count'><span class='deaths'></span>Deaths</div>
</div>
""")
addHtml("<div id='choropleth'/>")

add_css("""
.description {
  display: flex;
  padding: 15px 15px 30px;
}

.count {
  text-align: center;
  font-size: 20px;
  border-radius: 50%;
  width: 200px;
  height: 200px;
  padding: 26px;
}

.count span {
  display: block;
  font-size: 30px;
  font-weight: 100;
}
""")

Helpers.get.js("https://cdnjs.cloudflare.com/ajax/libs/d3/4.10.2/d3.js")
Helpers.get.js("https://cdn.plot.ly/plotly-latest.min.js")
Helpers.get.data("https://covid.ourworldindata.org/data/ecdc/total_cases.csv")
from js import Helpers
import json

Helpers.get.js("https://cdnjs.cloudflare.com/ajax/libs/d3/4.10.2/d3.js")
Helpers.get.js("https://cdn.plot.ly/plotly-latest.min.js")
Helpers.get.data("https://covid.ourworldindata.org/data/ecdc/total_cases.csv")
data = json.loads(Helpers.get.json("https://get.geojs.io/v1/ip/country.json"))
import numpy as np
from matplotlib import pyplot as plt

x = np.linspace(0.0, 2.0 * np.pi, 100)
y = np.sin(x)
plt.plot(x,y)
plt.show()
from js import output_element , Helpers , document
import json

data = json.loads(Helpers.get.json("https://get.geojs.io/v1/ip/country.json"))

table = output_element("table")

thead = table.createTHead();
row = thead.insertRow();

for key in data.keys():
    th = document.createElement("th");
    text = document.createTextNode(key);
    th.appendChild(text);
    row.appendChild(th);

row = table.insertRow();

for key in data.keys():
    cell = row.insertCell();
    text = document.createTextNode(data[key]);
    cell.appendChild(text);