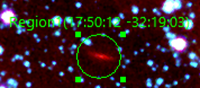
Python application to map the distribution of possible galactic sources in the zone of avoidance found with GLIMPSE3D. All colored dots except yellow and blue represent confirmed galaxies from different surveys and databases represented by their respective authors. The blue dots correspond to the newly identified sources found by eye inspection of infrared data near the galactic center (ZOA). Open circles represent galaxy clusters that are part of the Ophiuchus supercluster with its center at the cD cluster identified by a cross.
This project was presented at the 236th meeting of the American Astronomical Society (2020) and can be found here