-
Notifications
You must be signed in to change notification settings - Fork 34
SmartSeq2 Pipeline Timing and Cost
The cost of processing RNA-Seq on cloud computing depends one several factors. One is running time. Second is how many resources have been reserved during data processing. Third is machine type. It could be complicated to estimate the timing and cost. For example, to run one RSEM job, we can either request min resource, such as 1-core with 4Gb RAM machine or we can request a 4-core and 15Gb machine. The hourly rate of the first type of machine is cheaper than the second one but it takes longer time to finish job. The pricing page lists details.
In this task, we estimated the cost of processing scRNA-Seq data by using google cloud. The testing pipeline included the following modules/steps:
- STAR alignment [request 8-core and 40Gb RAM]
- RSEM to estimate gene counts [request 4-core and 4Gb RAM]
- FeatureCount to calculate gene/exon/transcript counts [request 1-core and 4Gb RAM]
- Picard to collect several sequencing and RNA-Seq specific metrics [request 1-core and 4Gb RAM]
- Python script to parse pipeline output [request 1-core and 2Gb]
Then we tested this pipeline on a published scRNA-Seq dataset, which includes 864 single cells full length RNA-Seq data. And we summarize the total hours(in hour) and total cost(in dollar) in the following table.
| StepName | Program/software | Machine Type | Total Hours | Total Cost | AVG Hours | AVG Cost |
|---|---|---|---|---|---|---|
| Star | Star | n1-highmem-8 | 292.133 | 140.115 | 0.338 | 0.1621 |
| RSEM | RSEM | n1-standard-4 | 151.983 | 29.376 | 0.1759 | 0.034 |
| CollectAlignemntMetrics | Picard | n1-standard-2 | 144.216 | 13.858 | 0.166 | 0.016 |
| CollectRnaMetrics | Picard | n1-standard-2 | 144.555 | 13.890 | 0.167 | 0.0160 |
| CollectInsertSizeMetrics | Picard | n1-standard-2 | 144.116 | 13.849 | 0.1668 | 0.016 |
| CollectDuplicationMetrics | Picard | n1-standard-2 | 144.433 | 13.958 | 0.167 | 0.0161 |
| FeatureCountsUniqueCounts | FeatureCount | n1-standard-2 | 144.266 | 14.179 | 0.167 | 0.0164 |
| FeatureCountsMultiCounts | FeatureCount | n1-standard-2 | 144.483 | 14.200 | 0.1672 | 0.0164 |
| CollectMetricsbySample | python | n1-standard-1 | 144.466 | 7.535 | 0.167 | 0.0087 |
| Total | 1454.65 | 260.9 | 0.30 |
Notice The Total Hours and Total Cost truly reflect the total amount of running one task in Google computing. It includes the image pulling, file localization and program running. Here is a timing per workflow of relative time spent on individual tasks of pipeline workflow.
We have tried several ways to improve the timing and cost of this pipeline. For example, STAR alignment takes up to 70% of running time so requesting multiple cores to allow STAR running on multiple threads has reduced significant amount overall running time. Another way to improve timing is to use tarball reference index files instead of compressed tarball(tar.gz). Extracting a compressed tarball reference index files could take up a significant amount time.
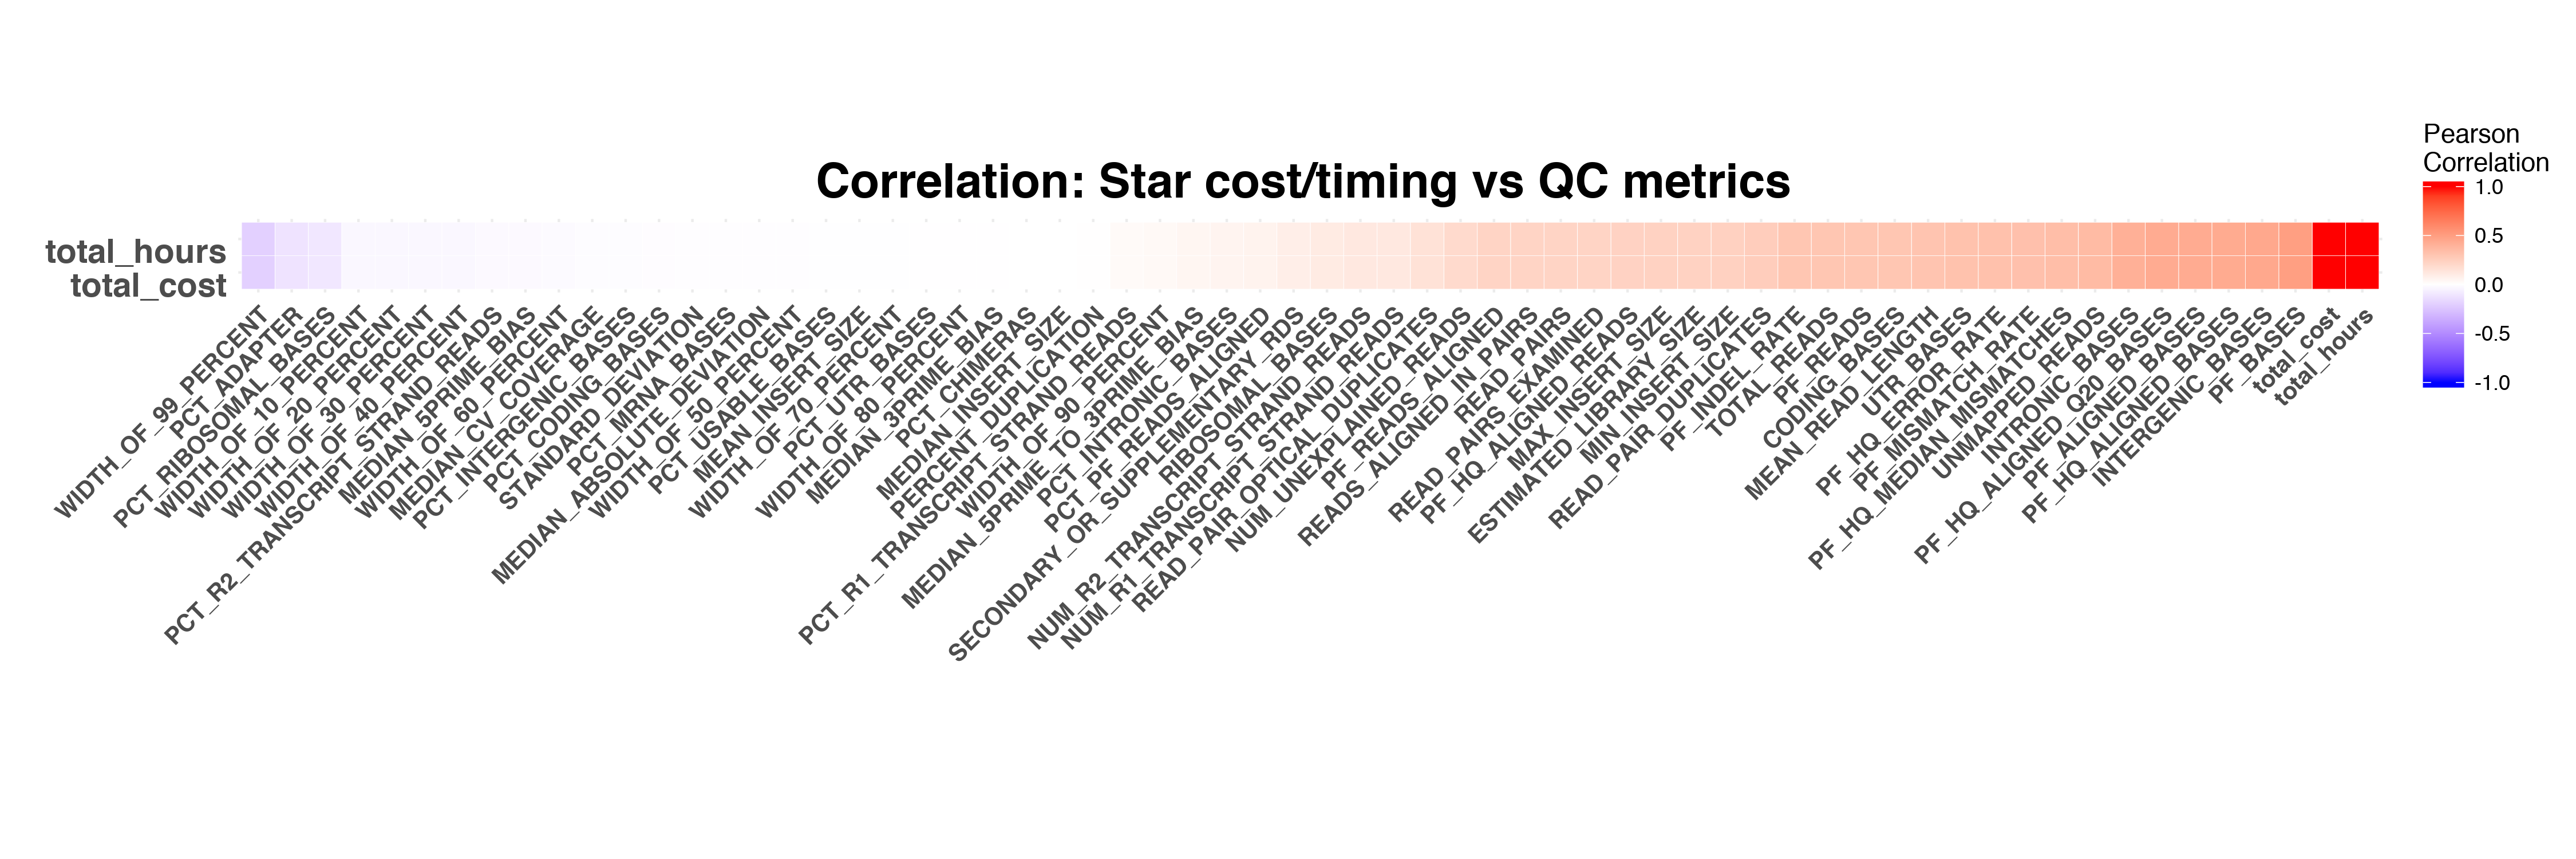
In this task, we tried to whether there is correlation between timing/cost of pipeline and RNASeq QC metrics. Furthermore whether we can use RNASeq QC metrics, such as TOTAL_REASA, to predict workflow running time.
First we calculated the correlation between overall pipeline running time/cost and RNASeq QC metrics. The overall pipeline running time and cost show correlation with several QC metrics, such as PF_BASES,INTERGENIC_BASES and PF_MISMATCH_RATE.

Next we calculated the correlation between each pipeline module's running time&cost and QC metrics.
STAR
 RSEM
RSEM
 FeatureCounts
 Picard Collect Metrics

The timing and cost of STAR and RSEM have stronger correlation to RNASeq QC metrics compared to the timing and cost of Picard and FeatureCounts.
Then we examined the impact of metrics PF_BASES, PF_ALIGNED_BASES,INTRONIC_BASES, PF_MISMATCH_RATE,MEAN_READ_LENGTH on pipeline running time and cost.
In general, PF_BASES,PF_ALIGNED_BASES and INTRONIC_BASES tell us the size of sequencing data. More bases means it will take long to do alignment. The metrics of PF_MISMATCH_RATE tell us the overall mismatching/error rate of sequencing data. This metrics could indicate the sequencing error or mutation or editing in genome.
PF_BASES on STAR

PF_ALIGNED_BASES on STAR

PF_MISMATCH_RATE on STAR

INTRONIC_BASES on STAR

CODING_BASES on STAR

PF_BASES RSEM

PF_ALIGNED_BASES on RSEM

PF_MISMATCH_RATE on RSEM

INTRONIC_BASES on RSEM

CODING_BASES on RSEM
