This is a collection of financial charts I made with react-vis and vx-charts/visx for projects of mine. Sharing these in case anyone else finds them useful, feel free to open up a PR if there are any you would like to add. Inspiration came from https://github.com/hshoff/viewsource.
react-vis: https://github.com/uber/react-vis
yarn add react-vis
vx/visx: https://github.com/airbnb/visx
yarn add @vx/vx
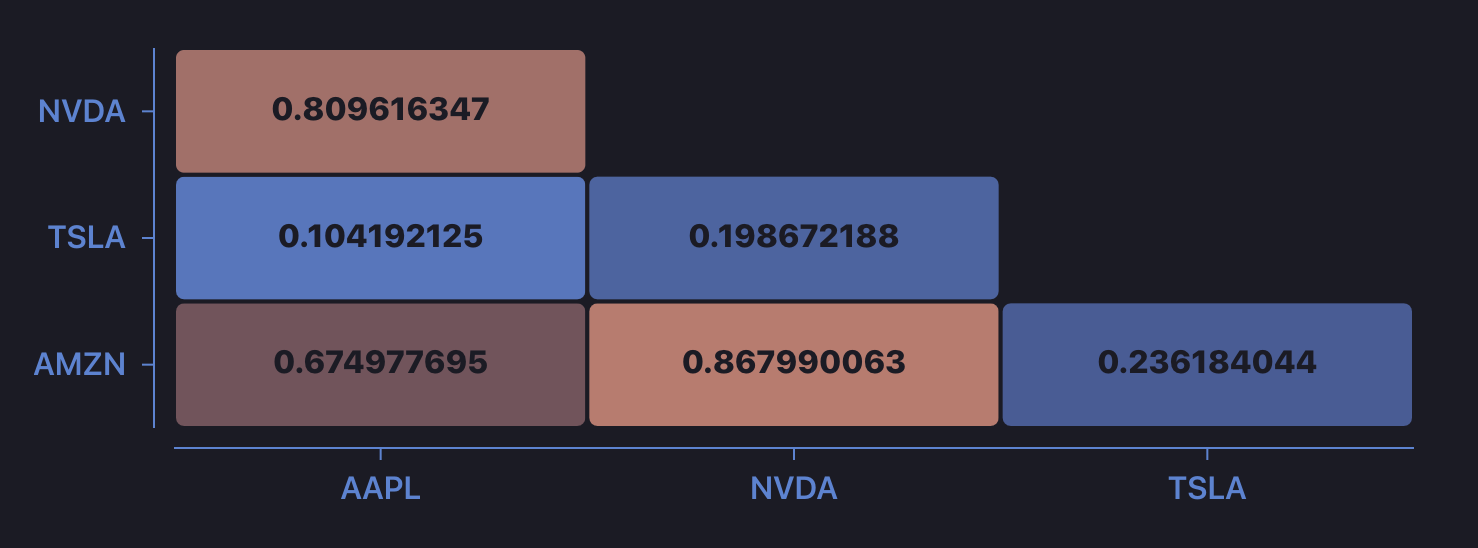
check out https://github.com/GunnarPDX/Correlations for backend usage examples
src/charts/MatrixChart.jsx
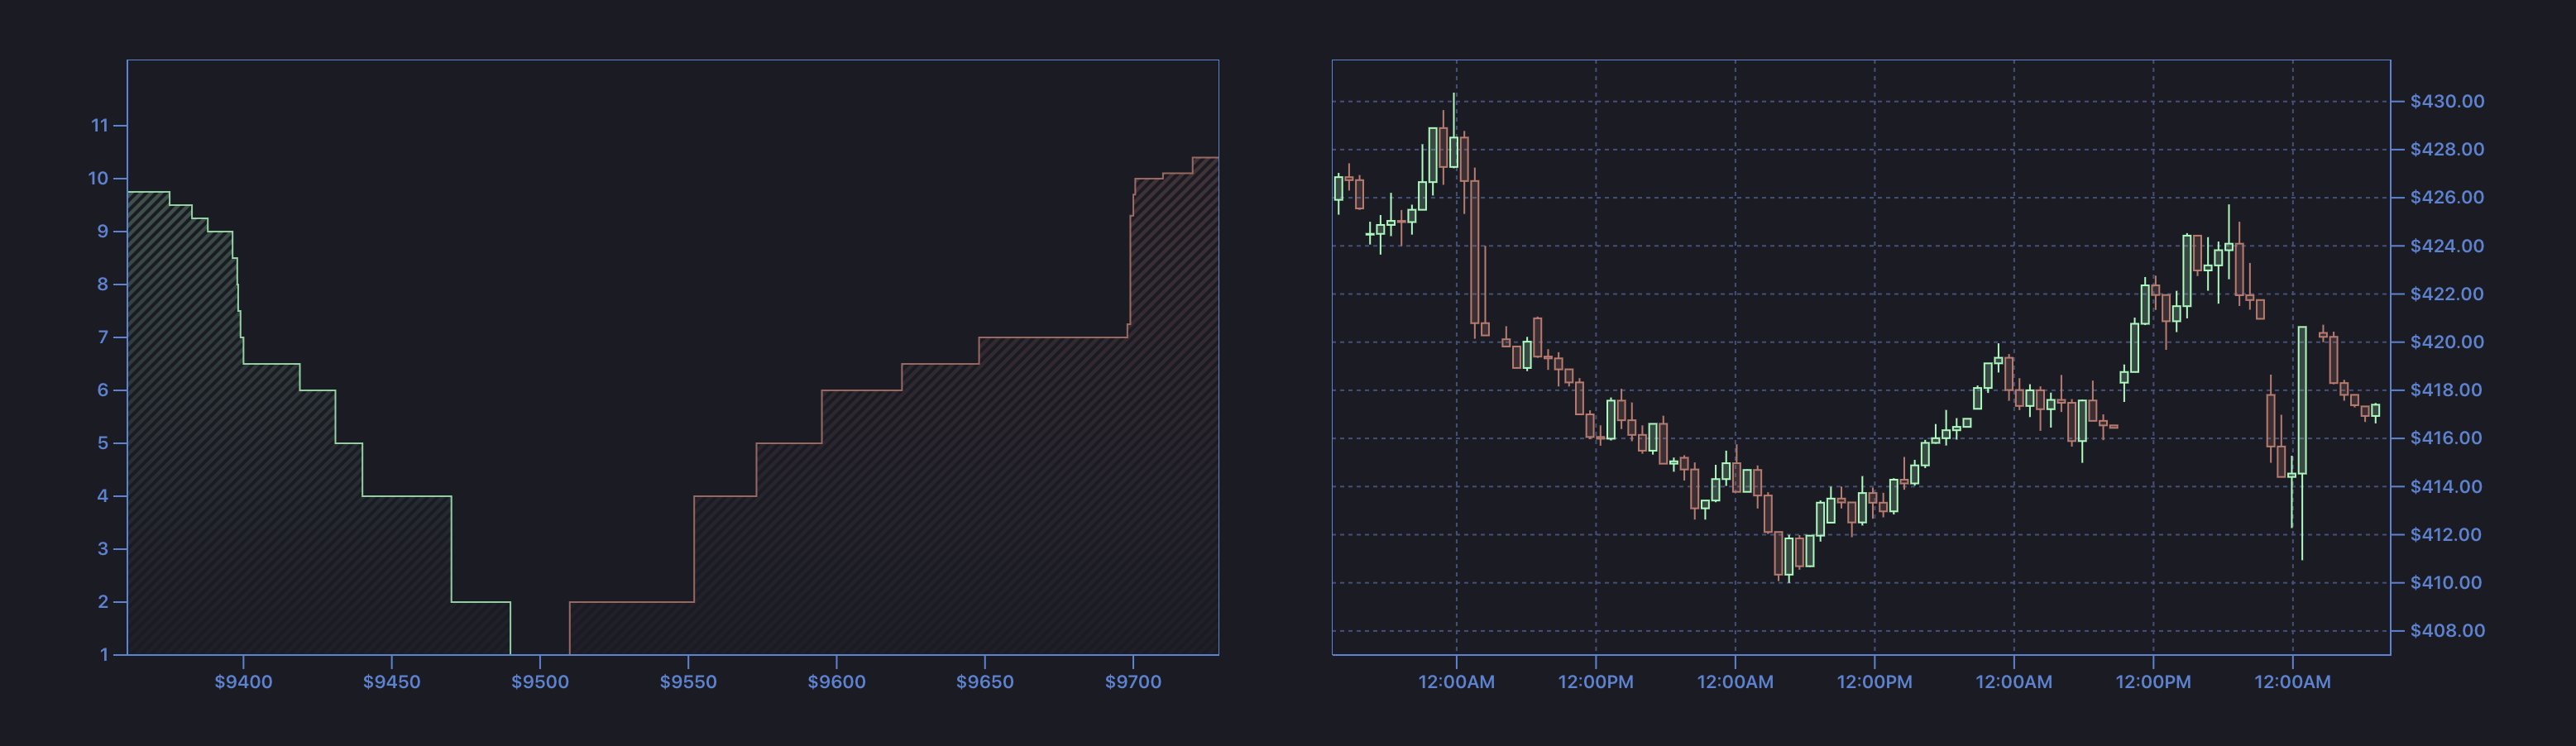
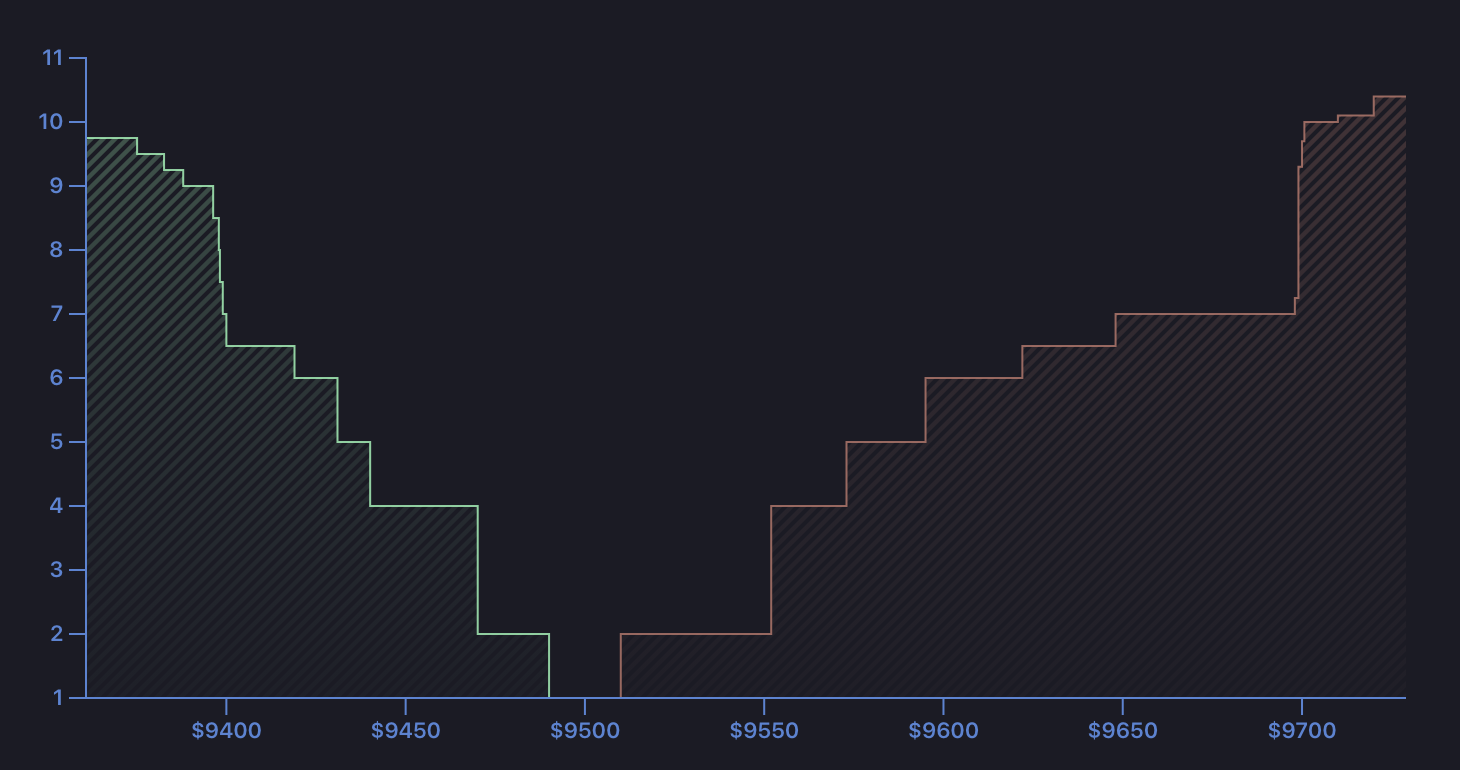
src/charts/OrderBookChart.jsx
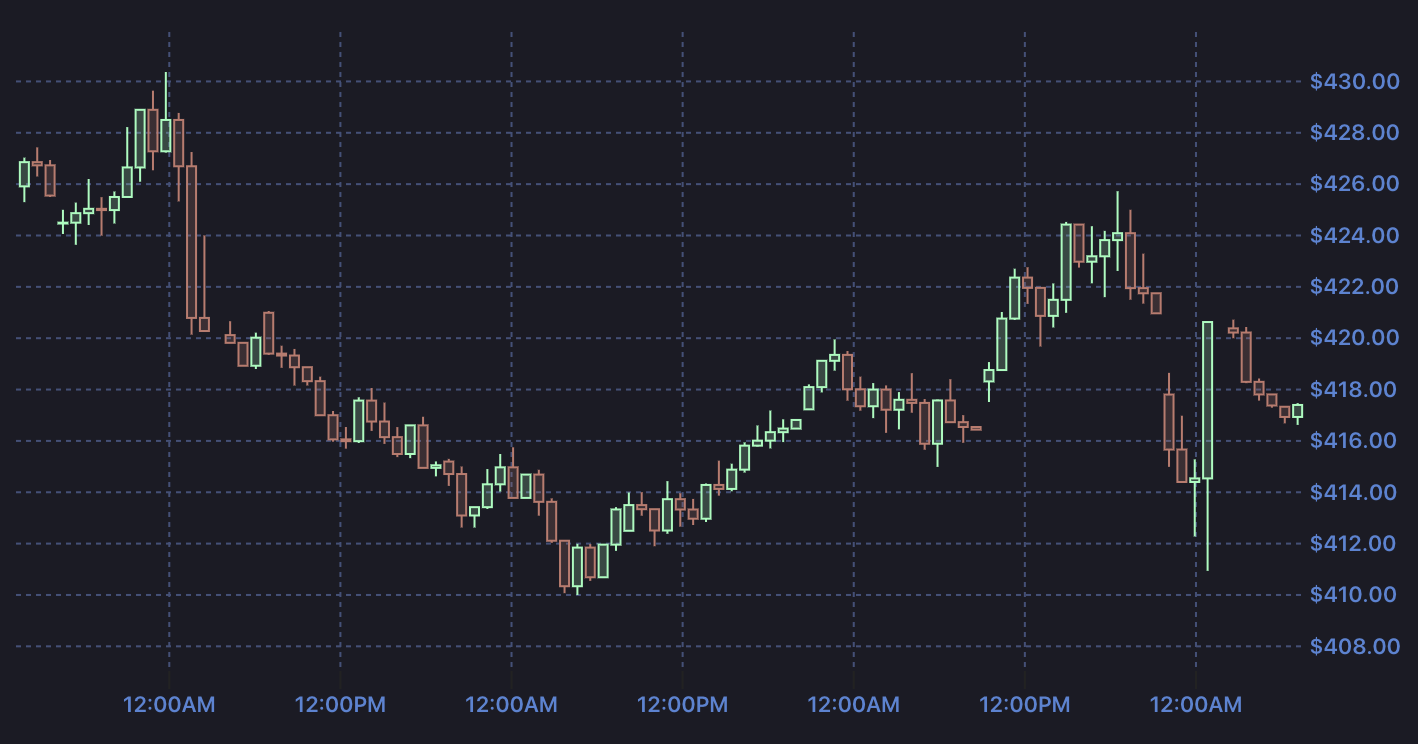
src/charts/CandlestickChart.jsx
src/charts/PriceChart.jsx
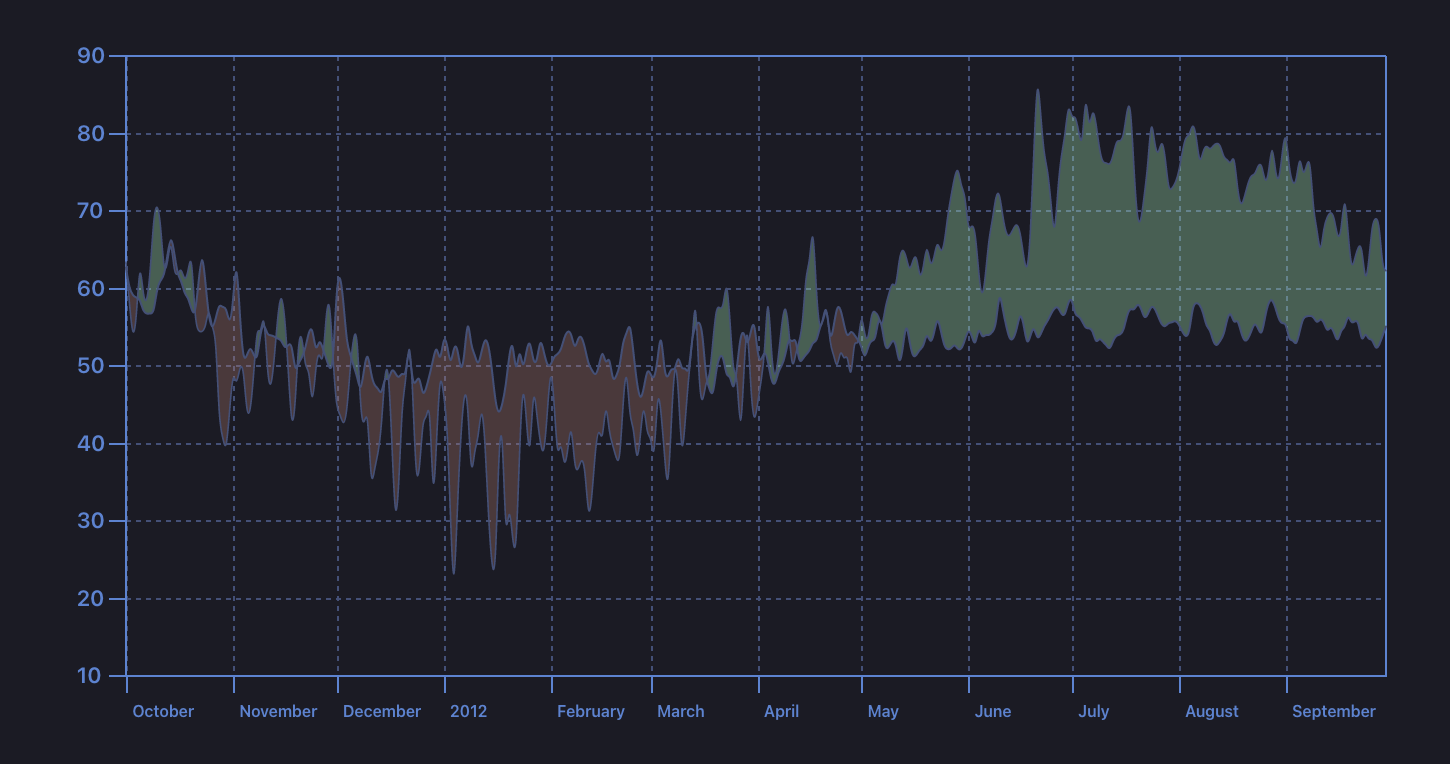
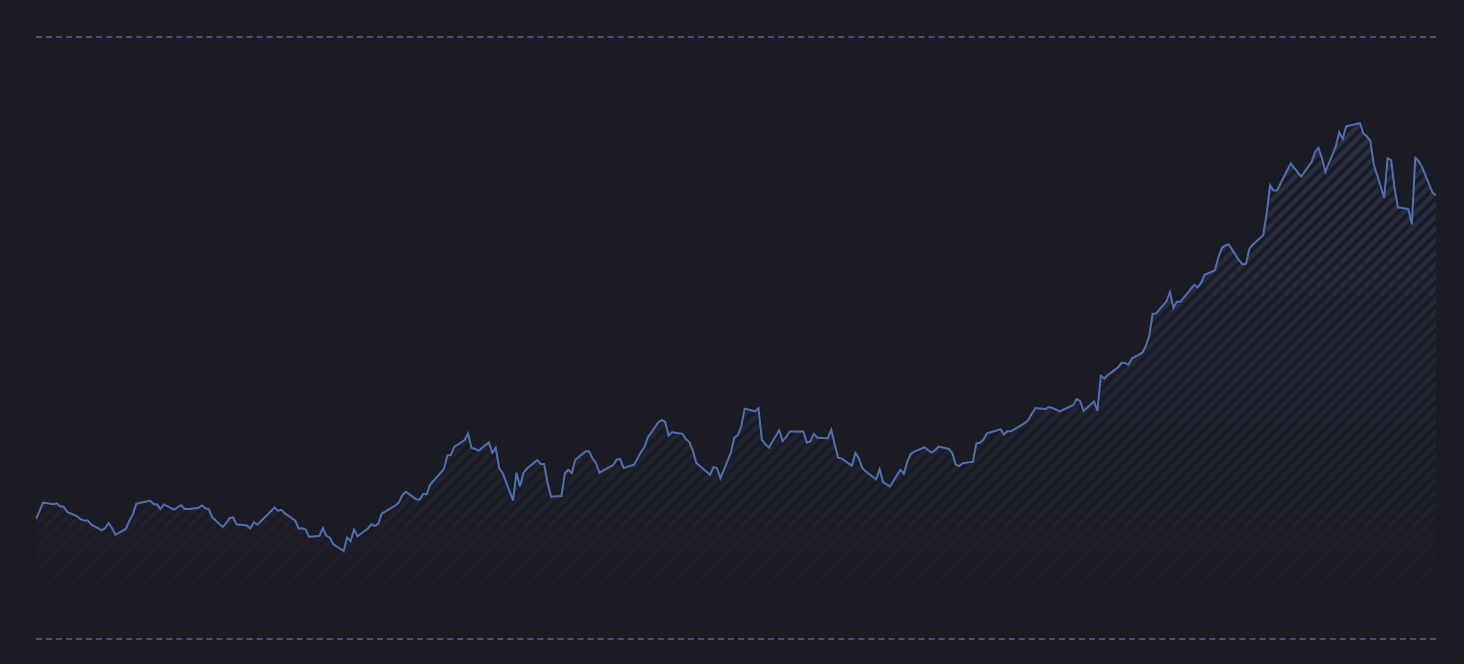
src/charts/AreaChart.jsx
src/charts/ThresholdChart.jsx