This repository contains the datasets, the scripts, solutions and slides needed for the 3h course "Introduction to R for bioimage analysis" given by Marion Louveaux during the NEUBIAS Training School 10 for Early Career Investigators in Luxembourg in 2019.
The format of this session was inspired by the Little Miss Tidyverse workshop given by Danielle Navarro for the Rladies Sydney.
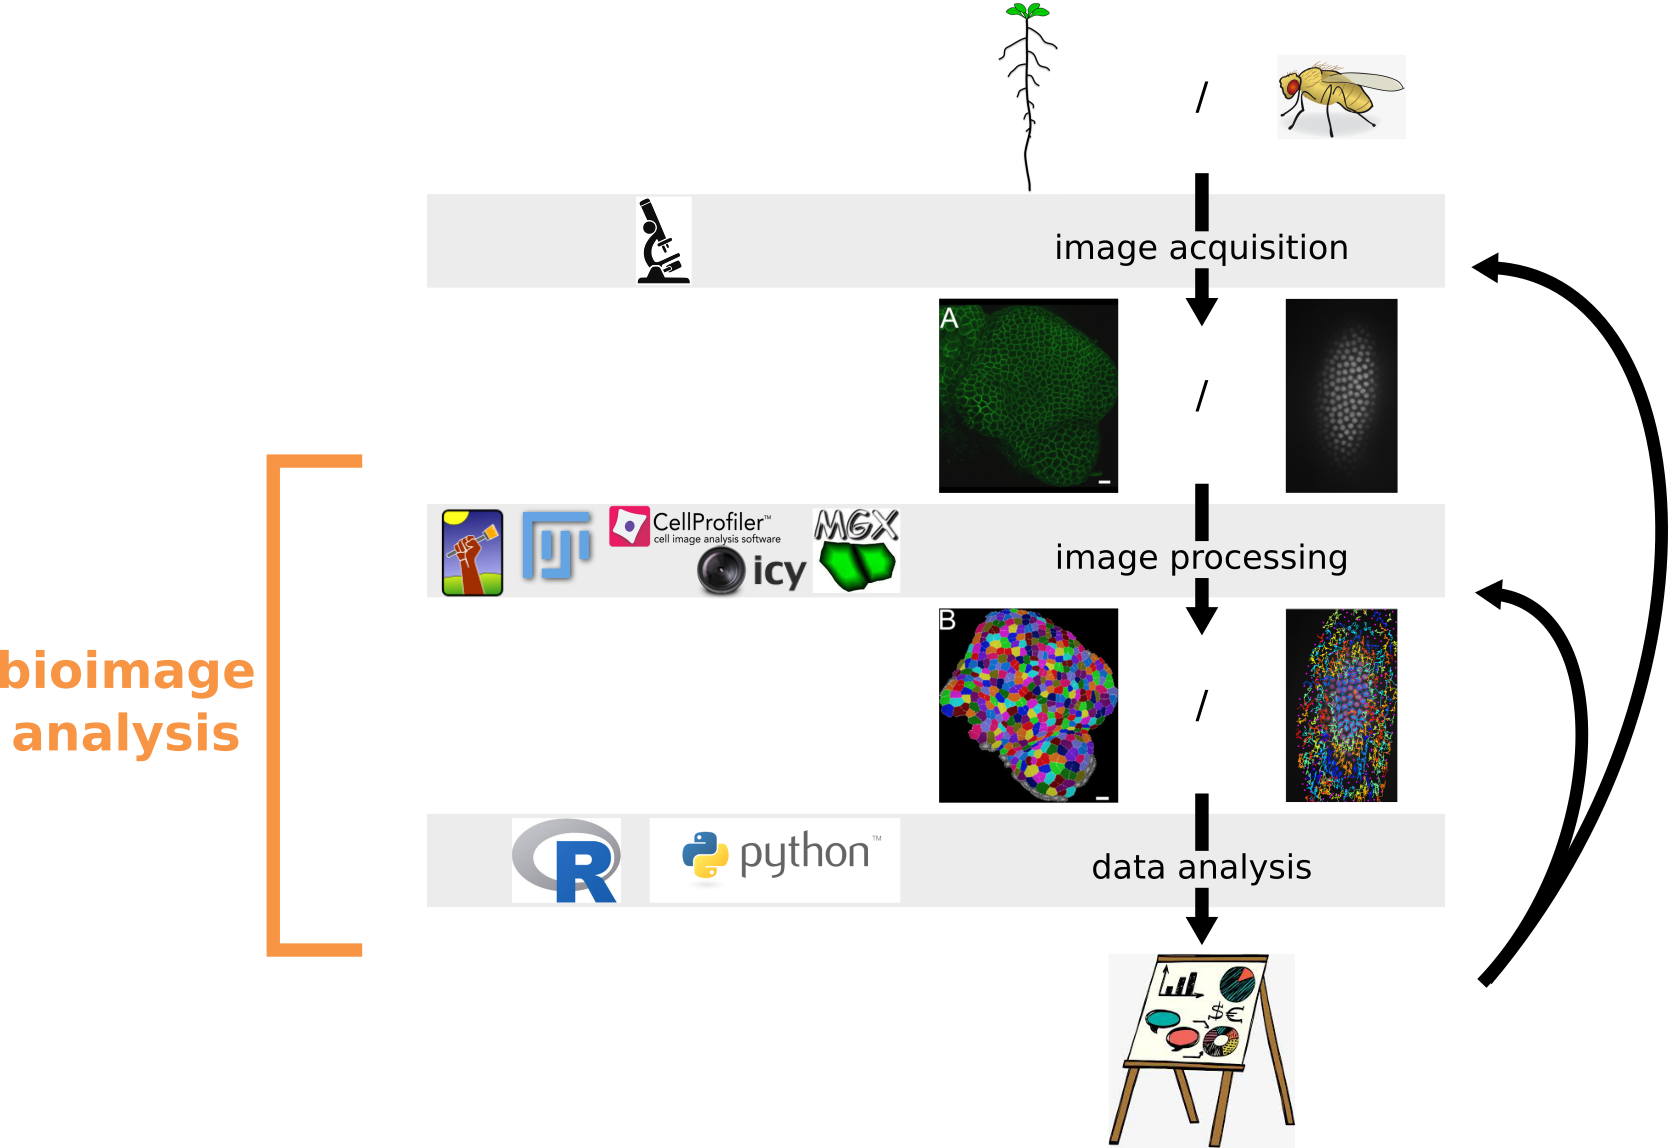
The definition of bioimage analysis given on the website of NEUBIAS, the european network of bioimage analysts is the following: "Bioimage analysis focuses on the quantitative measurement of biological systems by processing multidimensional image data. It hence aims at being as objective as possible in measuring Bioimages and estimating the underlying numerical parameters of the biological systems they capture, independently of human observation."
This session covers the basics of the R programming language in the context of a bioimage analysis workflow. It aims at getting started with the analysis of data extracted from one or several images, here tracking data. Tracking data were extracted using the Fiji plugin TrackMate and are available in /datasets/fly_embryo/.
The session covers the basics of data exploration and visualisation, but no statistics. It starts with an introduction to the Rstudio IDE (console, script, help and plot viewer, history...) and to the Rmarkdown format (notion of chunk, how to “knit”...). Regarding the R language itself, it focuses on the basics (how to execute a command, assign a variable, install and load a library), how to manipulate data (import data as dataframe, select columns, filter rows...) and how to create plots with ggplot2. The second part of the session is focused on more advanced exploration and analysis of the tracking data in their spatio-temporal context with two R packages: {mamut2r}, for the import of tracking data from the Fiji plugin TrackMate and the visualisation of tracks, and {cellviz3d}, for the 3D+time visualisation of the tracking data.
This work is licensed under a Creative Commons Attribution-ShareAlike 4.0 International License.

Install the following packages:
install.packages(c("magrittr", "dplyr", "readr", "here", "ggplot2", "ggthemes", "knitr",  "XML", "devtools")
devtools::install_github("marionlouveaux/cellviz3d")
devtools::install_github("marionlouveaux/mamut2r")- Local organisers: Aymeric d'Hérouel and Andreas Girod
- NEUBIAS chair: Julien Colombelli
- TS10 and TS11 organisers and helpers: Kota Miura, Jean-Yves Tinevez, Gaby Martins, Jonas Øgaard, Joyce Kao, Fabrice Cordelières, Ignacio Arganda-Carreras
- Data: Robert Haase
- mamut2r and cellviz3d help: Sébastien Rochette, Friederike Preu, Mike Smith
- MaMuT help: Jean-Yves Tinevez, Tobias Pietzsch, John Bogovic
R packages available on GitHub:
Tracking data (.xml and .csv) were generated with the Fiji plugin TrackMate.