Home

Logs generated by distributed systems are complex and unwieldy. They can be huge and contain extraneous details. It can be challenging to piece together logs generated at multiple hosts. Even if these logs contain ordering information, they are often still too complex for a developer to understand. ShiViz helps developers understand such logs through visualization.
ShiViz is implemented as a browser application, making it easy to use. ShiViz is useful for:
- Understanding the communication graph. Quickly scan the graph to identify the presence or absence of certain communication patterns.
- Reasoning about ordering in a concurrent or distributed setting. Visualize concurrency and the happened-before relation to understand if two events occurred concurrently, or if one happened before the other.
- Analyzing activity at processes that matter. Hide processes (and their log lines) for a more focused visualization. Filter by communication to a process to see only those events at other processes that were likely to have influenced the execution of a process you care about.
To visualize a log, paste it into ShiViz's input box and click visualize. A space-time diagram will appear. In the visualization:
-
Time flows from top to bottom.
-
The left panel shows the log and the middle panel displays a DAG of the partially ordered vector timestamps recorded in the input log.
-
A vertical line with a box at the top is a process timeline. This represents a single thread of execution (e.g., a process).
-
Circles on a process timeline are events that were executed by the process.
-
Diagonal lines connecting two events represent the happened-before relation between the events: the higher of the two events happened before the second event.
-
Dashed lines represent transitive communication edges. These only appear when a process is hidden, and two processes that are not hidden communicated indirectly through this process.
-
Larger circles represent merged local events. These have a number inside of them, indicating the number of events that they represent.
-
Radiating lines that fade out represent communication edges to processes that are currently hidden from view.
-
Each process is associated with a unique color. Log entries in the left column have the corresponding process color. By default, the log entries are sorted in the order in which the entries appear in the graph.

Multiple executions can be visualized simultaneously by separating multiple logs with a delimiter. This delimiter is specified by the user as a regular expression. For example, for three executions we would need two delimiters separating the first and second, and second and third, logs.
Trace labelling is also supported. This can be achieved by adding a capture group named trace to the regular expression which would capture the label for execution following the delimiter. Suppose we have a delimiter === Execution 1 ===, where "Execution 1" is the name of the following execution. Then the corresponding regular expression to represent the delimiter would be ^=== (?<trace>.*) ===$.
If, in our previous example, we wanted all three executions to be labelled, we would need three delimiters, one before each execution. Empty executions are ignored.
ShiViz parses the log using a user-specified regular expression. The regular expression must contain three capture groups:
-
event: The event message -
host: The host / process for the event -
clock: The vector clock, in JSON{"host": timestamp}format. The local host must be represented in the vector clock (i.e. the host specified in thehostcapture groups must be one of the hosts in the vector clock).
A parser regexp must be specified, otherwise an error will occur.
Additional capture groups can be used to capture fields such as date, IP, and priority. These fields will not be displayed in the log lines alongside the graph, but instead as a table in the sidebar when hovering over the event (unless the field's capture group is a sub-group of the event group). Field names muse be alphanumeric with no spaces.
For example, if we have a log event like:
28/07/14 01:35 PM Event executed
hostID {"hostID": 1, "otherHost": 2}
We could have a parser RegExp like:
(?<date>\d\d/\d\d/\d\d \d\d:\d\d (AM|PM)) (?<event>.*)\n(?<host>\w+) (?<clock>\{.*\})
- Hide traces while preserving ordering. Not all processes are useful to visualize. To hide a process timeline, double click the process box. To re-show the process timeline, double click on the process box in the "hidden hosts" panel. When a host is hidden, ordering information for events gleaned from that host is transitively applied to other events in the visualization:

-
Connect visualization events to log instance. Hover over the event circle or process box. The corresponding text will appear next to "Current node:". Click on an event circle to jump to that (highlighted) line in the input log.
-
Collapse local events to emphasize communication. ShiViz emphasizes ordering information TODO

Shiviz has the capability to automatically find and summarize interesting patterns or "motifs" within a graph. Consider a database system with a dozen clients. The clients request data from the database server periodically, and the server responds to each of those requests in turn. The resulting communication graph would contain a lot of these request-response communication patterns or motifs that Shiviz is equipped to find and provide useful information on.
The motifs currently supported are described briefly below. For a more formal description, please see the source code of motifFinder.js
A request response motif is a communication pattern between two hosts where one host sends a message to a second host, and the second host then sends something back to the first host.
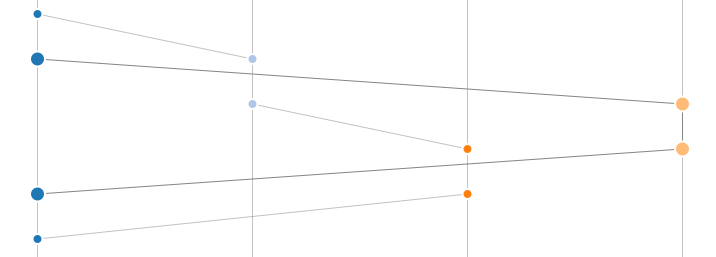
Shown above is an example of a request-response motif. The blue host requests data from the peach colored host.
Request-response motifs must satisfy the following:
-
There cannot be too many nodes between the nodes on either the responder or the requester's side
-
No node can have any edges apart from the ones that comprise the request and response
Intuitively, a broadcast motif is a communication pattern where a host sends messages to other hosts in quick succession.
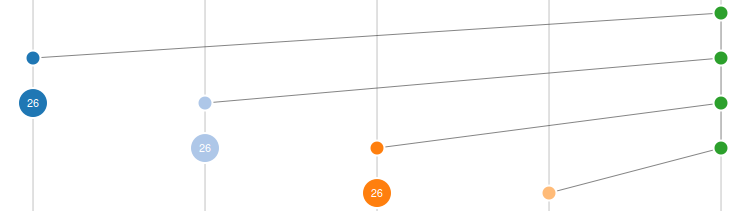
Shown above is an example of a broadcast motif, with the green host sending messages to the others. Broadcast motifs must meet the following requirements:
-
The host must broadcast to a minimum of three different hosts
-
No node except the first may have any parent edges