To run Grafana with Prometheus and node exporter to track your node statictics you need:
- Install Grafana on server
- Clone repo with easy setup of prometheus and node exporter and execute install.sh
- Check that prometheus and node exporter running on your server
systemctl status prometheus
systemctl status node_exporter.service
- Login to Grafana IP:3000 with initial password admin/admin and update password with your own.
- Add new Prometheus Datasource Prometheus_server_IP:8090, save configuration.
- Import grafana dashboard from file
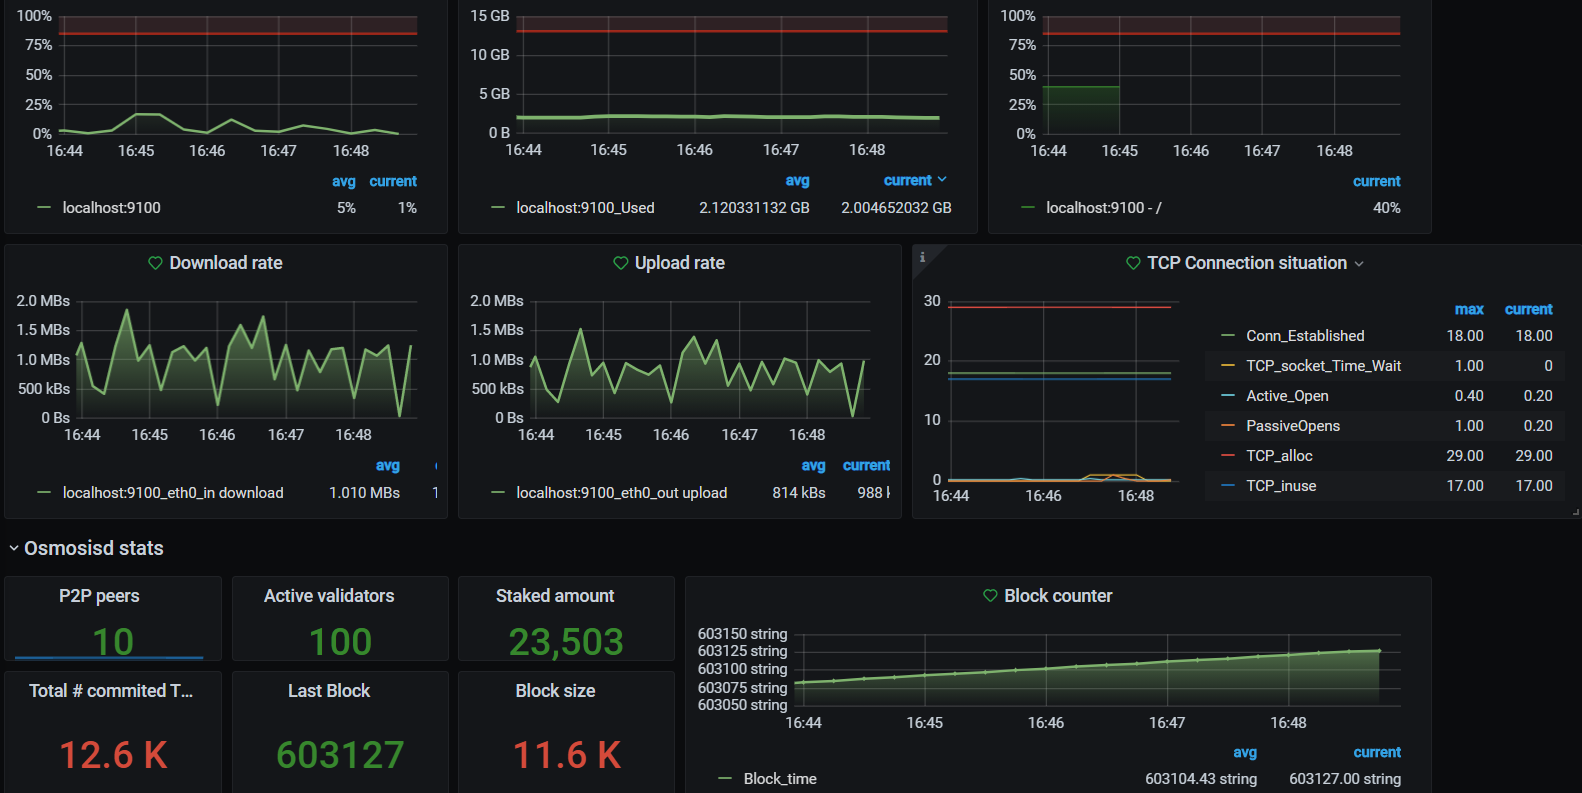
You will get similar to this:
- Also you can configure alerts and notifications