👋 Welcome to the Altruistiq front-end hiring task!
Objective
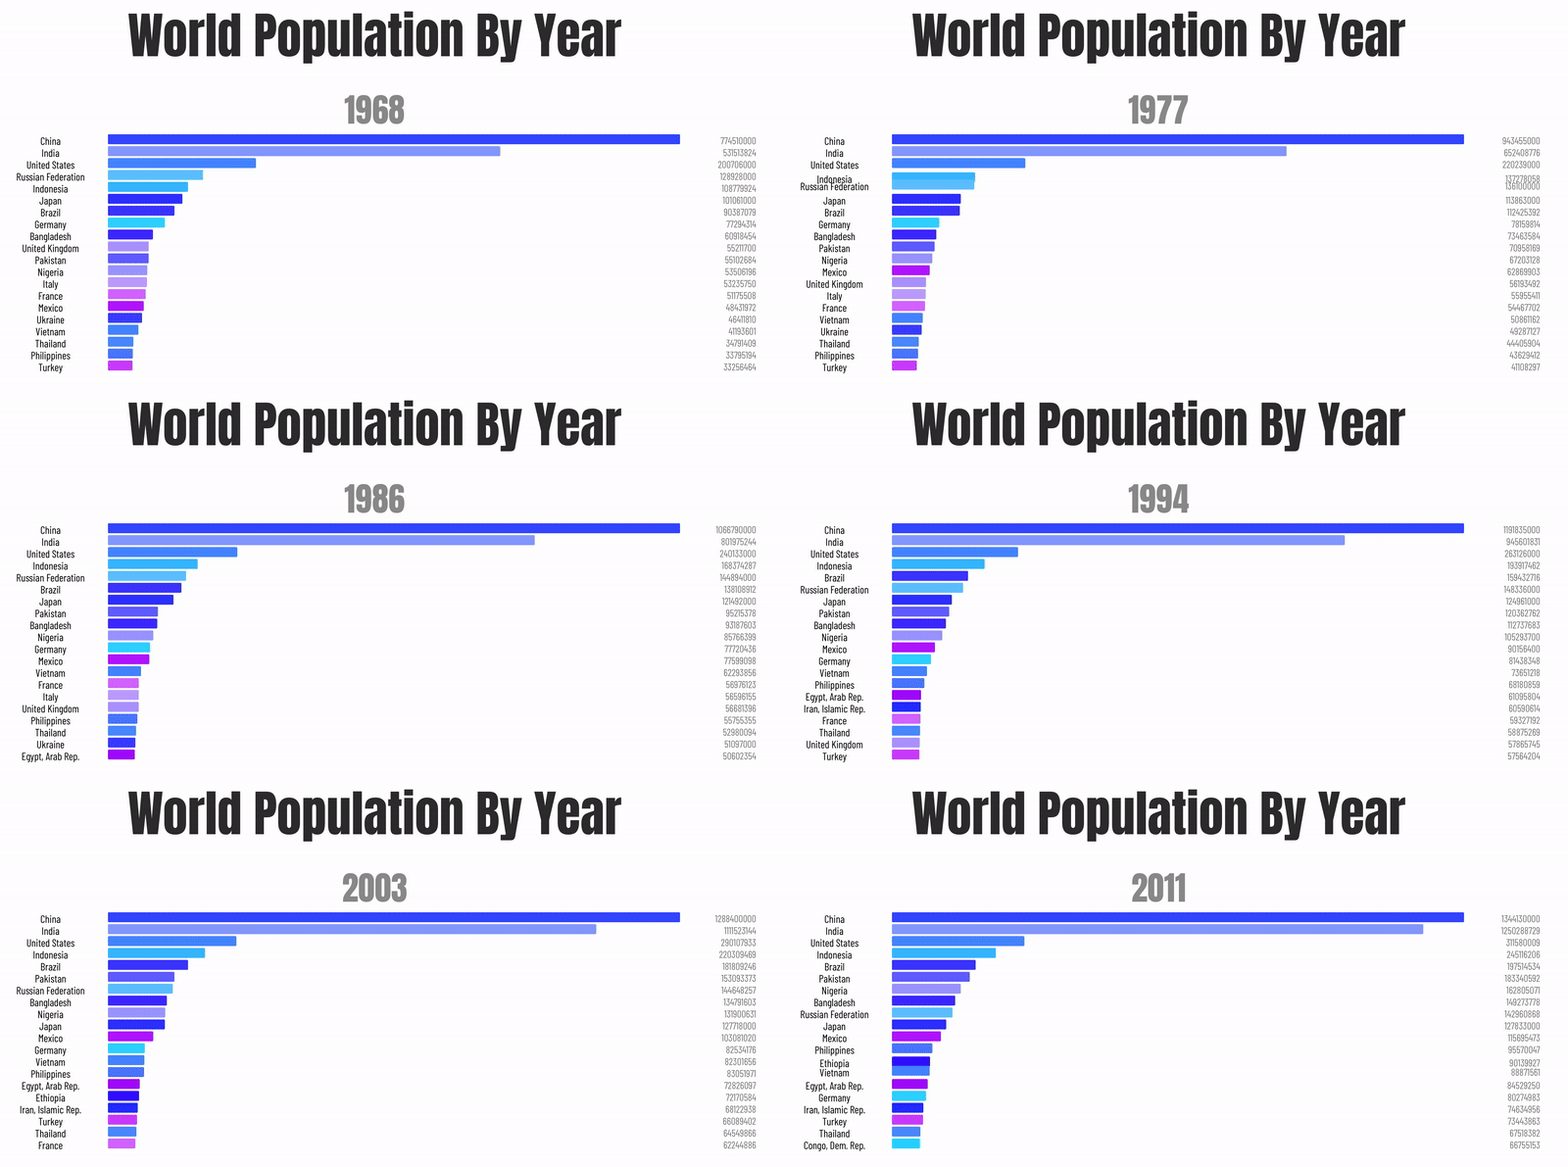
Create a chart animating carbon footprint per country throughout the years. The below chart is an example for world population (see for animated version. The provided Figma file shows the one-page app that you should build for this task.
Requirements
- Implement the provided Figma file as a Vue app
- Use data from the Footprint network
- Create the chart
- Calculate and show world total footprint on the page
Stretch goals
- animate the sorting and bar length of the chart as per the provided example.
- chart should be responsive, test by changing the window size (dragging)
- cache data with timeout of 5 minutes, making sure upon reload the app conditionally uses stored data
Get started
-
Get this Figma file. The ... in the chart is a placeholder. The idea is that you show all the countries from the API response in the chart.
-
Clone this repo, then
npm iandnpm run devto start a development app (uses Vite, Vue 3 and Pinia) -
Put the received secret in the
.envfile as theVITE_API_CREDENTIALS -
Use the 2 API calls provided in the store to get a list of countries and to get emission data per country per year. Do this for all countries. To chart the carbon footprint for a specific year, you need the
carbonattribute from the response. Note that for some countries data for a specific year is missing.
Suggestions
- We suggest spending max 4 hours on this task. The goal is not to deliver a complete application but to have code for discussion. It's up to the candidate to scope the work how they see fit.
- Consider first defining the data structure that you intend to use to create the chart.
- Use the types defined in
src/typings/Country.tsto help you - Talk about your approach.
