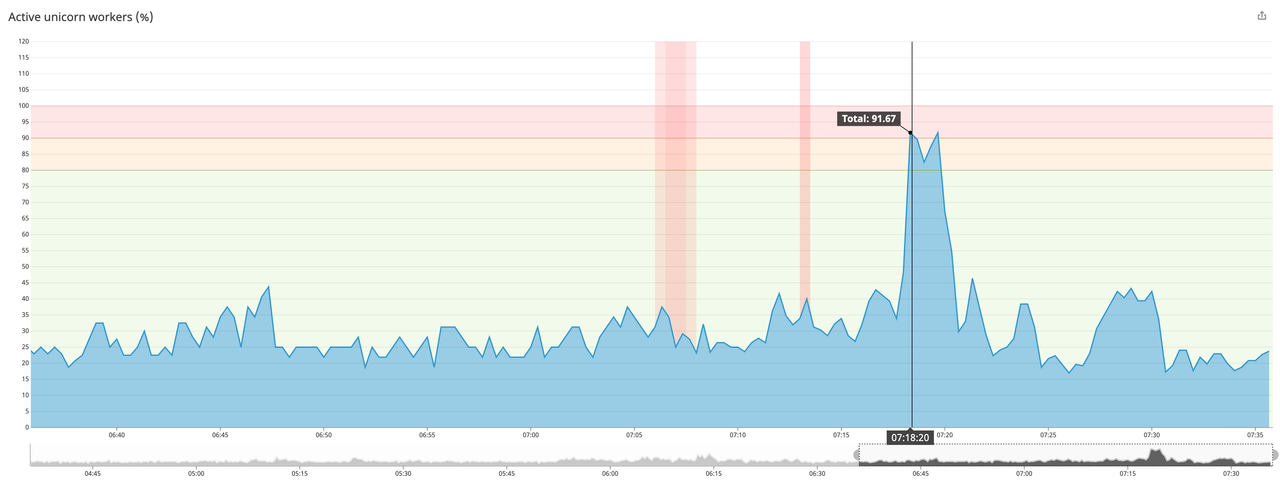
For pre-forking HTTP servers like Unicorn, workers utilization is an important capacity indicator, which can help to avoid requests queuing.
In Zendesk we have developed Raingutter to perform high frequency polling of Unicorn utilization stats in order to get a better visibility of our capacity utilization and unveil spikes.
A good understanding of our application capacity utilization, has been particularly helpful to properly scale our application during the migration to K8s. The metrics generated by Raingutter are also helpful to implement the K8s Horizontal Pod Autoscaler, based on an indicator that directly correlates to capacity exaustions.
Other solutions exists, but they all have their caveats:
- They don't offer enough granularity (eg:
Datadog Agent v5can only execute custom checks every 15s) - There is no guarantee that metrics are always collected (eg:
Datadog Agent v6collector works on a best effort model)
Raingutter currently supports two methods of collecting TCP connections metrics:
- Built in socket monitoring (based on
/proc/net/tcp): information about active TCP connections are retrieved from the OS, no external dependencies required (recommended). - Raindrops gem a real-time stats toolkit to show unicorn statistics
Multi-threaded web server like Puma can be also monitored by Raingutter with the built in socket monitoring.
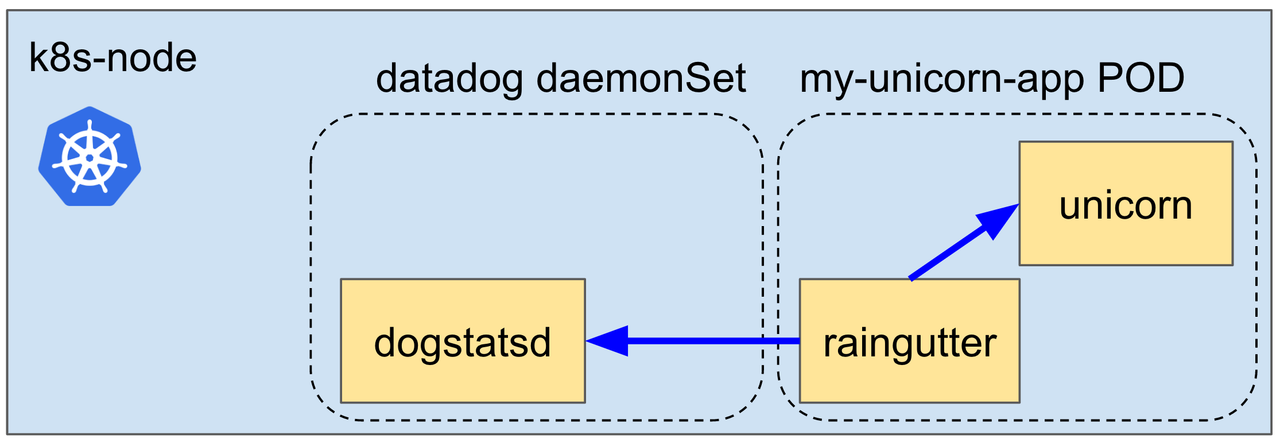
The stats polled by Raingutter can be streamed as histograms to dogstatsd, exposed as Prometheus endpoint and/or printed to STDOUT as JSON.
Raingutter is a single binary that can run as a sidecar container if your application is deployed on Kubernetes.
The following environment variables can be used to configure Raingutter:
RG_USE_SOCKET_STATS: Enables or disables the built in socket monitoring (default:true)RG_FREQUENCY: Polling frequency in milliseconds (default:500)RG_SERVER_PORT: Where the web server listens to
UNICORN_WORKERS: Total number of unicorn workers (required if running on K8s)RG_RAINDROPS_URL: Raindrops endpoint URL (eg:http://127.0.0.1:3000/_raindrops). Only required if Raindrops is used as collection method.
RG_THREADS: Enabled support for multi-threaded web serversMAX_THREADS: Total number of allowed threads
POD_NAME: Name of the k8s pod (required)POD_NAMESPACE: K8s pod namespace (required)PROJECT: Project tag (required)
RG_STATSD_ENABLED: If set totruemetrics are streamed to the dogstatsd histogram interface (default:true)RG_STATSD_HOST: IP address of the local dogstatsd instance (required ifRG_STATSD_ENABLEDistrue)RG_STATSD_PORT: Port number of the local dogstatsd instance (required ifRG_STATSD_ENABLEDistrue)RG_STATSD_NAMESPACE: A string to prepend to all statsd calls (default:unicorn.raingutter.agg.)RG_STATSD_EXTRA_TAGS: A list of extra tags to be passed to dogstatsd, as comma-separated key:value pairs (ie.tagname:tagvalue,anothertag:anothervalue)
RG_PROMETHEUS_ENABLED: If set totruemetrics are exposed to<IP>:8000/metrics(default:false)
RG_LOG_METRICS_ENABLED: If set totruemetrics are logged to STDOUT in JSON format (default:false)
---
apiVersion: extensions/v1beta1
kind: Deployment
metadata:
  name: my-unicorn-app
  labels:
    project: my-unicorn-app
    role: app-server
spec:
  selector:
    matchLabels:
      project: my-unicorn-app
      role: app-server
  template:
   spec:
      containers:
      - name: unicorn
        image: unicorn:latest
        ports:
          - name: main-port
            containerPort: 3000
            protocol: TCP
        env:
        - name: UNICORN_WORKERS
          value: '16'
      - name: raingutter
        image: raingutter:latest
        env:
        - name: PROJECT
          value: 'my-unicorn-app'
        - name: POD_NAME
          valueFrom:
            fieldRef:
              fieldPath: metadata.name
        - name: POD_NAMESPACE
          valueFrom:
            fieldRef:
              fieldPath: metadata.namespace
        - name: RG_USE_SOCKET_STATS
          value: 'true'
        - name: RG_SERVER_PORT
          value: '3000'
        - name: RG_STATSD_HOST
          value: '192.168.0.1'
        - name: RG_STATSD_PORT
          value: '8125'
        - name: RG_FREQUENCY
          value: '500'
        - name: UNICORN_WORKERS
          value: '16'
       securityContext:
          runAsNonRoot: true
          readOnlyRootFilesystem: true
Setup a local k8s testing environment with Skaffold:
- Make sure to have Kubernetes available locally (e.g.:
minikube) - Setup the correct namespaces
make setup-skaffold
- Install Skaffold and run it in development mode
$ skaffold dev
- (OPTIONAL) Install Prometheus and Grafana on K8s
$ helm init
$ helm install \
    --name=prometheus \
    --version=7.0.0 \
    stable/prometheus
$ helm install \
    --name=grafana \
    --version=1.12.0 \
    --set=adminUser=somepassword \
    --set=adminPassword=somepassword \
    --set=service.type=NodePort \
    stable/grafana
- Get the service port via:
kubectl get svcand login onhttp://localhost:<service-port>/login - Use port-forward to hit the Prometheus endpoint
export pod=$(kubectl get pods -l app=rg -o go-template --template '{{range .items}}{{.metadata.name}}{{"\n"}}{{end}}'); kubectl port-forward $pod 8000
Sean Goedecke [email protected]: implementation of the built in socket monitoring (based on /proc/net/tcp)
Create a Pull Request with your changes, ping someone and we'll look at getting it merged.
Copyright 2019 Zendesk
Licensed under the Apache License, Version 2.0 (the "License"); you may not use this file except in compliance with the License.
You may obtain a copy of the License at http://www.apache.org/licenses/LICENSE-2.0
Unless required by applicable law or agreed to in writing, software distributed under the License is distributed on an "AS IS" BASIS, WITHOUT WARRANTIES OR CONDITIONS OF ANY KIND, either express or implied. See the License for the specific language governing permissions and limitations under the License.

