Visualize simulations coverage metrics #355
Comments
|
Ad-hoc solution with a Jupyter notebook: 
Python code used to generate the plotimport pandas as pd
import matplotlib.pyplot as plt
import matplotlib.cm as cm
import seaborn as sns
import json
import numpy as np
# Load the data
data = []
with open('SIMpirateship.ndjson') as f:
for line in f:
data.append(json.loads(line))
df = pd.DataFrame(data)
plt.figure(figsize=(20, 20))
plt.subplot(5, 5, 1)
plt.plot(df['duration'], df['distinct'], marker='x', linestyle='--', color='black', label='distinct')
plt.plot(df['duration'], df['generated'], marker='o', linestyle='-', color='blue', label='generated')
plt.xlabel('Duration')
plt.ylabel('Count')
plt.grid(True)
plt.legend()
i = 2
colors = cm.rainbow(np.linspace(0, 1, len(df['distinctvalues'].iloc[-1].keys())))
for value, color in zip(df['distinctvalues'].iloc[-1].keys(),colors):
plt.subplot(5, 5, i)
plt.plot(df['duration'], df['distinctvalues'].apply(lambda x: x.get(value, None)), marker='o', linestyle='-', label=value, color=color)
plt.xlabel('Duration')
plt.ylabel('Count')
plt.legend()
i += 1
plt.show()
# Bar Plot of Action Occurrences
actions_df = pd.json_normalize(df['actions'])
actions_sum = actions_df.sum().sort_values(ascending=False)
plt.figure(figsize=(12, 8))
sns.barplot(x=actions_sum.values, y=actions_sum.index)
plt.title('Occurrences of Actions')
plt.xlabel('Occurrences')
plt.ylabel('Actions')
plt.tight_layout()
plt.show() |
|
Hi, |
|
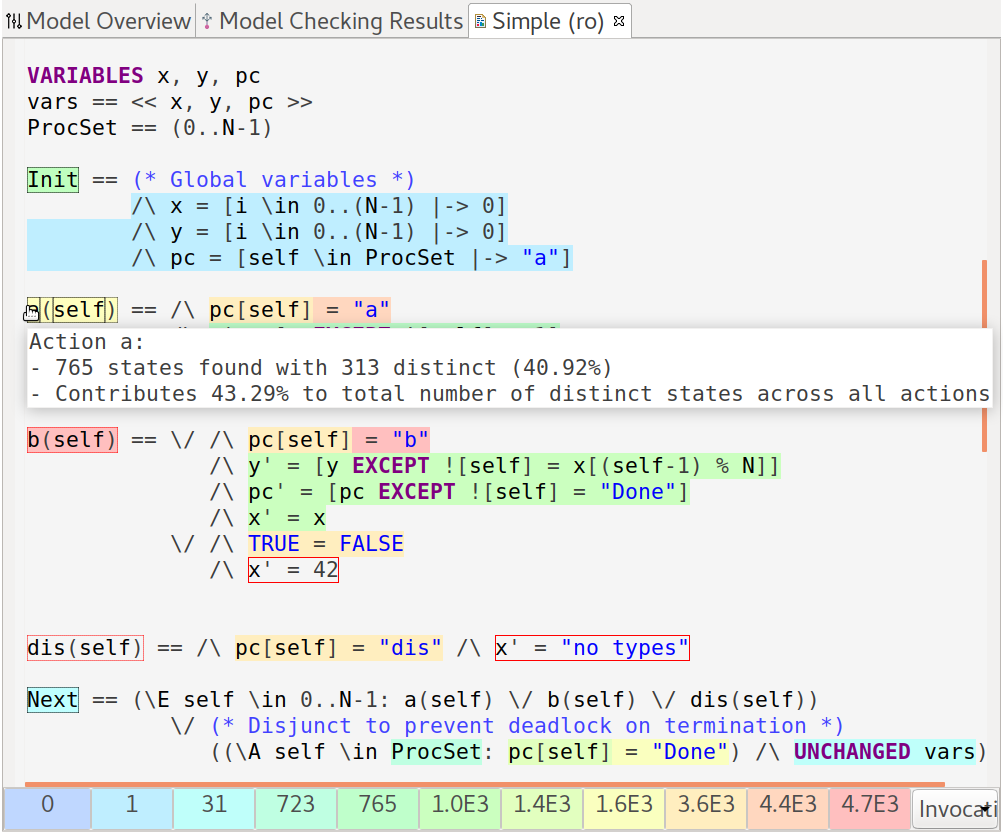
@melhindi If TLC is run with the PrintCoverage ==
Serialize(<<TLCGet("spec")>>, "Coverage.json", [format |-> "NDJSON", charset |-> "UTF-8", openOptions |-> <<"WRITE", "CREATE", "APPEND">>])However, unfortunately, the VSCode extension does not currently support the Toolbox’s heatmap feature that you’ve shown in your screenshot. |
|
@lemmy, thanks; quick follow-up question: Is it correct to assume that Re Heatmap feature: Yes, I know it is currently not supported, but is heatmap part of this Feature/Issue? (I think a heatmap would be useful :) ) |
Yes, you won't need
Glad that you find the heatmap useful! This issue isn't narrowly scoped; the heatmap might very well be part of it. However, nobody has volunteered to implement any of it. |
Simulation is the only viable approach for checking very large specifications. However, evaluating the coverage of simulation remains challenging. Recent TLC improvements (tlaplus/tlaplus@05d7555, tlaplus/tlaplus@f764fbf, tlaplus/tlaplus@52f5445, tlaplus/tlaplus@84ac434, tlaplus/tlaplus@23f7650, tlaplus/tlaplus#897, ...) enable the simulator to generate relevant data with minimal overhead. The data provides detailed statistics, including the frequency of each action during the simulation run. Additionally, it reports the number of distinct states as well as the distinct values observed for each variable. Below is the `TLCGet("stats") output of some spec that has been periodically serialized and appended to a ndjson file:
{"traces":34008,"duration":60,"generated":4494285,"behavior":{"actions":{},"id":34001},"worker":0,"distinct":114033,"distinctvalues":{"view":12906,"byzActions":3,"byzCommitIndex":815,"log":46310,"crashCommitIndex":2875,"viewStable":7,"prepareQC":11881,"primary":11,"network":132576},"retries":1072284,"actions":{"ByzPrimaryEquivocate":718,"ReceiveNewView":1345,"TLCInit":3863,"DiscardMessage":35400,"ByzOmitEntries":1039,"ReceiveVote":19495,"ReceiveEntries":22039,"BecomePrimary":2211,"SendEntries":15310,"SIMTimeout":39448},"levelmean":40,"levelvariance":3598}
{"traces":55070,"duration":120,"generated":7731406,"behavior":{"actions":{},"id":55045},"worker":0,"distinct":197538,"distinctvalues":{"view":15302,"byzActions":3,"byzCommitIndex":1507,"log":100942,"crashCommitIndex":5987,"viewStable":7,"prepareQC":24650,"primary":11,"network":228738},"retries":1916909,"actions":{"ByzPrimaryEquivocate":1253,"ReceiveNewView":1658,"TLCInit":6476,"DiscardMessage":45686,"ByzOmitEntries":1881,"ReceiveVote":46795,"ReceiveEntries":52333,"BecomePrimary":2747,"SendEntries":34179,"SIMTimeout":50139},"levelmean":40,"levelvariance":3599}
{"traces":73621,"duration":180,"generated":10719760,"behavior":{"actions":{},"id":73603},"worker":0,"distinct":285915,"distinctvalues":{"view":16531,"byzActions":3,"byzCommitIndex":1960,"log":157986,"crashCommitIndex":8146,"viewStable":7,"prepareQC":36543,"primary":11,"network":305309},"retries":2688213,"actions":{"ByzPrimaryEquivocate":1698,"ReceiveNewView":1820,"TLCInit":8732,"DiscardMessage":51342,"ByzOmitEntries":2573,"ReceiveVote":73822,"ReceiveEntries":82462,"BecomePrimary":3052,"SendEntries":53313,"SIMTimeout":56217},"levelmean":40,"levelvariance":3599}
{"traces":91259,"duration":240,"generated":13621215,"behavior":{"actions":{},"id":91246},"worker":0,"distinct":408069,"distinctvalues":{"view":17197,"byzActions":3,"byzCommitIndex":2849,"log":222994,"crashCommitIndex":10350,"viewStable":7,"prepareQC":46790,"primary":11,"network":399602},"retries":3451052,"actions":{"ByzPrimaryEquivocate":2183,"ReceiveNewView":1972,"TLCInit":10931,"DiscardMessage":55897,"ByzOmitEntries":3259,"ReceiveVote":101518,"ReceiveEntries":112795,"BecomePrimary":3288,"SendEntries":72996,"SIMTimeout":60832},"levelmean":40,"levelvariance":3599}
{"traces":108707,"duration":300,"generated":16505833,"behavior":{"actions":{},"id":108691},"worker":0,"distinct":475861,"distinctvalues":{"view":17707,"byzActions":3,"byzCommitIndex":3261,"log":286325,"crashCommitIndex":11558,"viewStable":8,"prepareQC":55935,"primary":11,"network":488048},"retries":4215577,"actions":{"ByzPrimaryEquivocate":2593,"ReceiveNewView":2095,"TLCInit":13113,"DiscardMessage":59892,"ByzOmitEntries":3930,"ReceiveVote":129800,"ReceiveEntries":143794,"BecomePrimary":3507,"SendEntries":92792,"SIMTimeout":65029},"levelmean":40,"levelvariance":3600}
{"traces":143730,"duration":360,"generated":21148903,"behavior":{"actions":{},"id":143712},"worker":0,"distinct":617491,"distinctvalues":{"view":25658,"byzActions":3,"byzCommitIndex":3416,"log":326387,"crashCommitIndex":11835,"viewStable":9,"prepareQC":59906,"primary":11,"network":622257},"retries":5321678,"actions":{"ByzPrimaryEquivocate":3386,"ReceiveNewView":3437,"TLCInit":17049,"DiscardMessage":97038,"ByzOmitEntries":4937,"ReceiveVote":149567,"ReceiveEntries":165896,"BecomePrimary":5869,"SendEntries":108035,"SIMTimeout":106604},"levelmean":40,"levelvariance":3600}
{"traces":165211,"duration":420,"generated":24433212,"behavior":{"actions":{},"id":165203},"worker":0,"distinct":694114,"distinctvalues":{"view":27429,"byzActions":3,"byzCommitIndex":3690,"log":380037,"crashCommitIndex":13507,"viewStable":9,"prepareQC":66216,"primary":11,"network":723477},"retries":6163977,"actions":{"ByzPrimaryEquivocate":4000,"ReceiveNewView":3769,"TLCInit":19689,"DiscardMessage":107570,"ByzOmitEntries":5680,"ReceiveVote":176642,"ReceiveEntries":195457,"BecomePrimary":6413,"SendEntries":126777,"SIMTimeout":117604},"levelmean":40,"levelvariance":3600}
{"traces":183742,"duration":480,"generated":27425643,"behavior":{"actions":{},"id":183741},"worker":0,"distinct":805771,"distinctvalues":{"view":28363,"byzActions":3,"byzCommitIndex":3962,"log":431900,"crashCommitIndex":14709,"viewStable":9,"prepareQC":72556,"primary":11,"network":815484},"retries":6948086,"actions":{"ByzPrimaryEquivocate":4549,"ReceiveNewView":3973,"TLCInit":22009,"DiscardMessage":113791,"ByzOmitEntries":6361,"ReceiveVote":203984,"ReceiveEntries":225983,"BecomePrimary":6727,"SendEntries":146346,"SIMTimeout":124126},"levelmean":40,"levelvariance":3600}
{"traces":201383,"duration":540,"generated":30332605,"behavior":{"actions":{},"id":201359},"worker":0,"distinct":888312,"distinctvalues":{"view":28975,"byzActions":3,"byzCommitIndex":4179,"log":485666,"crashCommitIndex":16319,"viewStable":9,"prepareQC":77091,"primary":11,"network":892538},"retries":7714189,"actions":{"ByzPrimaryEquivocate":4964,"ReceiveNewView":4104,"TLCInit":24233,"DiscardMessage":118267,"ByzOmitEntries":7063,"ReceiveVote":231933,"ReceiveEntries":257258,"BecomePrimary":6940,"SendEntries":165917,"SIMTimeout":128824},"levelmean":40,"levelvariance":3600}
Using the (serialized) data, users can manually create various statistics and plots to visualize the simulator's coverage (examples of such plots are available at microsoft/CCF#6537 (comment)). An earlier prototype even automatically regenerated the plot during simulation (https://www.youtube.com/watch?v=btikdh4xZQ0). I propose that the TLA+ VSCode extension should automatically generate these plots from the ndjson file and display them, for instance, within the model checking view.
Technology candidates
The text was updated successfully, but these errors were encountered: