Start digging in the data mines for this module here
'Shaft', by Kačka a Ondra, Flickr
<iframe width="420" height="315" src="https://www.youtube.com/embed/jIfu2A0ezq0" frameborder="0" allowfullscreen></iframe>#Qualitative data vs Quantitative
- how do you see patterns in words?
- or, you realize that you can count the patterns that clusters of words make up
http://biodiversitylibrary.org/page/37047310#page/496/mode/1up
- and many approaches
- traditionally, easier to get money to develop a new tool than to do research using that tool
- voyant-tools.org
- Cogwheel icon at top-right
- Especially useful: RezoViz, Bubble Lines
- see my Ferfuson post
- overviewproject.org
- Look at distributions of words over a corpus
- TF-IDF
- The cat sat on the mat. Then the cat chased the rat.
- The cat slept all day on the mat.
- The rat ran across the floor.
- cat sat mat cat chased rat
- cat slept all day mat
- rat ran across floor
- compare every pair of documents
- multiply the frequencies of corresponding words
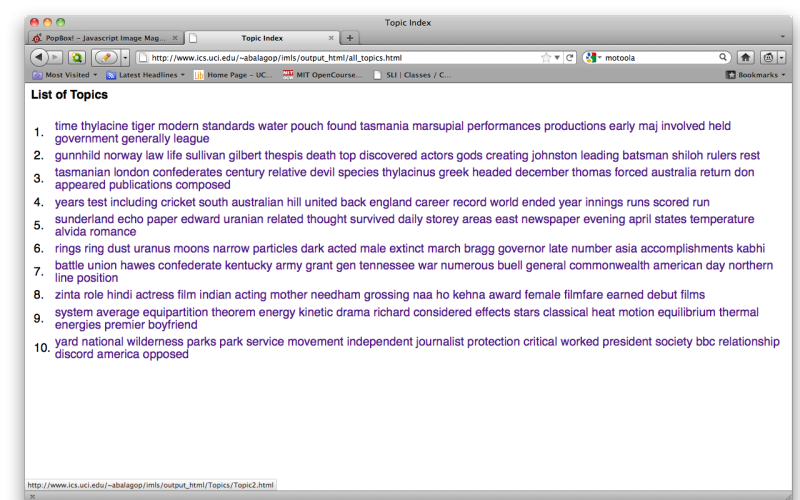
- many approaches go under the term 'topic modeling'
- most common in humanities approaches: LDA
- What % of this text is composed by a 'war' topic?
- How do you know what 'war' words are?
- supervised vs. unsupervised
- we all just pull from bags of words, right?
- Heatmap
- Network
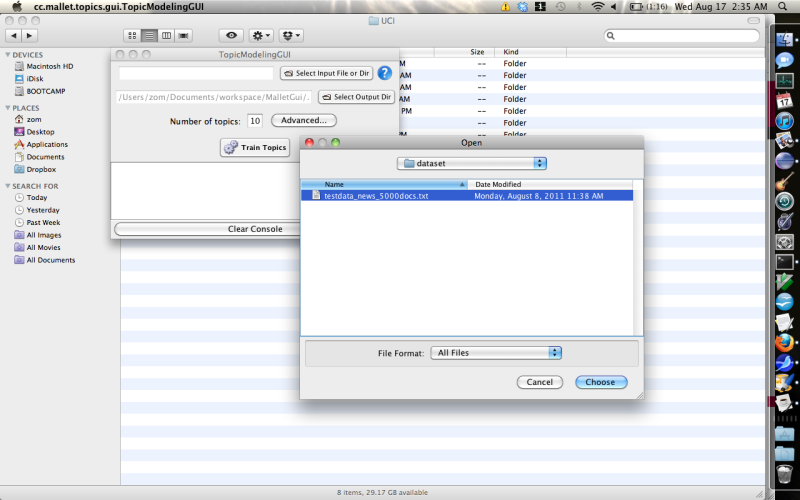
- Using a MALLET on the CND
- Rstudio.org
- AntConc
- NER
- SNA with Gephi


