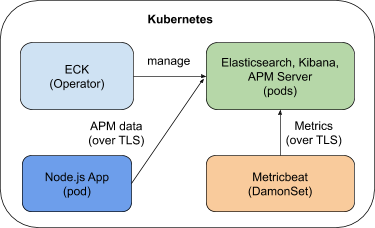
Explore and understand the ECK operator, In this exercise we will be focusing on:
- Understanding how we can ease Day1 and Day2 operations using the ECK operator
- Create our own
Elasticsearchcluster backed up byKibana - Getting familiar with the different installation components
Make sure you connect to the cluster before starting this exercise!
Login to the Openshift Console and create a project using the Project tab on te left. Hit the Create a new project button and create your own project:
Click the Add+ button in order to consume a resource from Openshift's marketplace. Pick the Operator Backed button in order to consume As-A-Service Elasticsearch cluster.
Pick the Elasticsearch Cluster resource and hit Create to start the deployment:
Under the Create Elasticsearch section, and make sure you understand each one of the values presented in the YAML.
Switch the number of Elasticsearch instances to 1 and hit the Create button on the down left in order to complete the installation:
Make sure your Elasticsearch cluster was successfully installed and that you can see all of its compnents:
Veirfy that your Elasticsearch cluster installation had been successful by using the Project -> Pods in the inventory:
Here you can see that you have deployed your Elasticsearch instance that can be scaled out/in whenever needed, we'll see later on how we can scale our cluster easily.
Ensure that the your node has attached a PVC coming from our default StroageClass using Project -> PVCs on the left tab:
In order to test our Elasticsearch cluster, Let's create a Route to expose our cluster's traffic outside of the cluster.
In the Openshift Console, hit Project -> Routes and then make sure you hit the Create Route button.
Call your route elastic-http, make sure you pick the right service to point to (in our case it's elasticsearch-sample-es-http).
Port redirection is picked by default, use a Passthrough Secured Route as presented in the following image:
Hit the Create button and move on.
After creating your Route, Make sure you can see its Location and that its status is in Accepted mode.
Go back to your Topology View and click the arrow (Open URL) the Elasticsearch instance has on the top right:
Make sure you leave the default values and hit the Create button.
Question - It seems like our Elasticsearch requires authentication, where can we find it?
As we are using an operator, lots of the things are created automatically and we don't need to configure them.
The credentials for example for the Elasticsearch instance are created automatically by the operator an can be found in the Secrets tab on the left tab.
Under Secrets. search for the elasticsearch-sample-es-elastic-user secret, click it and press the Copy To Clipboard button to copy the password:
After you have copied the password, make sure you login to the authentication page you got earlier using the elastic username and the password you've copied one second ago:
Great! we have accessed our Elastic API and we'll be able to ingest data later on.
Now let's create our Kibana instance, so we'll be able to visualize the data we ingest to Elasticsearch.
Click the Add+ button in order to consume a resource from Openshift's marketplace. Pick the Operator Backed button in order to consume a Kibana instance.
Pick the Kibana resource and hit Create to start the deployment:
Switch to the YAML View, make sure you understand every field the YAML presents to you.
Question - How does our Kibana instance knows which Elastic to refer to?
Hit the Create button on the Create Kibana section that was opened to create our instance.
Make sure both Elastic and Kibana are up and ready to use by navigating to Project -> Pods:
In order to test our Kibana cluster, Let's create a Route to expose our cluster's traffic outside of the cluster.
In the Openshift Console, hit Project -> Routes and then make sure you hit the Create Route button.
Call your route kibana-http, make sure you pick the right service to point to (in our case it's kibana-sample-es-http).
Port redirection is picked by default, use a Passthrough Secured Route as presented in the following image:
Hit the Create button and move on.
Again, verify that you have the correct status for your Route and try to navigate to it.
Important! make sure you copy the Elasticsearch password as before as we need it to login to Kibana
Login to Kibana:
Congratulations! You have completed the forth exercise :)


