-
Notifications
You must be signed in to change notification settings - Fork 7
03 Working with Spreadsheets Part 2
RepoState.ods allows you to quickly generate charts of our dataset, without interfering with the actual data.
Some examples are inside LO/img.
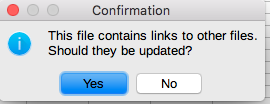
The spreadsheet is linked to the csv data files, which is why you will see the following prompt when first opening it in LibreOffice.
-
yesoverride all existing filters, and gets the latest additions. -
nowill make sure you see the files as the last person saving it
There are three types of sheets:
- sheets linked to csv files, with basic filters to derive unique values (red)
-
lookupsheets that resolve ID column with their matching headings using functions(blue) -
displaysheets for easy copying into your favorite chart generating apps with all functions removed and just the values (green)
If you find a useful way of looking at the data, feel free to share it by adding new sheets, and a graphic of how you display it. You can look at the non-color coded sheet for some ideas how functions can help you to prepare your data for quick visualizations.
The links are one way. That means that changes to the data tables made in the spreadsheet will not update the csv files. Because the lookup tables are linked to the first tables, new data will populate all other sheets. However, you need to updated (using paste-special) the display sheets manually.
The current graphics are displaying a) all primary sources that appear in readings acts, and how often they are mentioned, and b) the authors which appear in reading acts, with the number of distinct titles, and how often they are mentioned.

