Releases: percona/pmm
v3.0.0
Percona Monitoring and Management 3.0.0
| Release date | January 30th, 2025 |
|---|---|
| Installation | Installing Percona Monitoring and Management |
| Upgrade | Migrate PMM 2 to PMM 3 |
Percona Monitoring and Management (PMM) is an open source database monitoring, management, and observability solution for MySQL, PostgreSQL, and MongoDB.
PMM empowers you to:
- monitor the health and performance of your database systems
- identify patterns and trends in database behavior
- troubleshoot issues effectively
- execute database management tasks seamlessly, whether your databases are on-premises or in the cloud
General availability of PMM 3.0.0
We're excited to announce the General Availability of PMM 3.0.0, a new major version that introduces a complete architectural overhaul of PMM.
This milestone delivers major security improvements with rootless deployments, encryption of sensitive data, enhanced stability through containerized architecture, and improved user experience with flexible monitoring configurations. Key changes include official ARM support, MongoDB 8.0 monitoring, and a streamlined upgrade process.
Release summary
- Security enhancements
- Enhanced stability
- Improved user experience
- Monitoring improvements
- Breaking API changes
- Component upgrades
- Improvements
- Fixed issues
Security enhancements
Support for rootless deployments
Using the root user in applications poses a significant security risk, particularly when outdated software is installed or resides in the environment.
PMM Server now supports rootless deployment through multiple methods, including the latest versions of Podman, Helm, Docker, Virtual Appliance, and Amazon AWS.
This rootless setup enhances security by eliminating the need for root privileges to create, run, and manage containers. By running PMM Server as a non-root user, you avoid granting root permissions on the host system, providing an additional layer of protection against potential vulnerabilities and security breaches.
For instructions on deploying rootless PMM, check the Setting up PMM Server topic.
UI-based upgrades for Podman installations
You can now upgrade PMM Server installations running under Podman directly through the PMM Configuration > Updates panel in the UI.
This functionality integrates Watchtower for automated container updates and requires configuration of new environment variables (PMM_WATCHTOWER_HOST, PMM_WATCHTOWER_TOKEN) as well as relevant systemd service settings.
For detailed configuration instructions, see Installation with UI updates.
Encryption of sensitive data
Plaintext passwords and credentials are among the top ten security risks identified by OWASP (Open Web Application Security Project).
To address this risk, PMM now encrypts all sensitive information stored in its database. This includes usernames, passwords, AWS keys, Azure credentials, and TLS/SSL certificates, significantly enhancing the security of your monitoring environment. Even though we recommend minimal privileges for monitoring user accounts, you can rest assured that the sensitive data is protected!
By default, PMM generates an encryption key and stores it at /srv/pmm-encryption.key. Alternatively, you can define a custom path for the encryption key using the new environment variable PMM_ENCRYPTION_KEY_PATH.
When upgrading to PMM 3, any existing unencrypted PMM 2 data will be encrypted automatically.
For more information, see PMM data encryption.
Enhanced API authentication with Grafana service accounts
We've made a significant enhancement to the way API authentication is handled. PMM no longer relies on API keys as the primary method for controlling access to the PMM Server components and resources. Instead, PMM now leverages Grafana service accounts, which provide a more secure and manageable authentication mechanism compared to API keys.
Service accounts provide better security through fine-grained access control while maintaining detailed audit logs of all actions. This includes comprehensive tracking of elevated privilege operations and improved visibility into access patterns - continuing the logging capabilities previously available with API keys.
Migration from API keys
With this change, API keys are now deprecated and will be automatically converted to service accounts. Here's what happens when upgrading from PMM 2 to PMM 3:
- your existing API keys remain functional but are moved to service accounts
- the conversion happens when you first log in as an Admin user or via CLI
- your integrations will continue working with the same API key credentials (hash values remain unchanged)
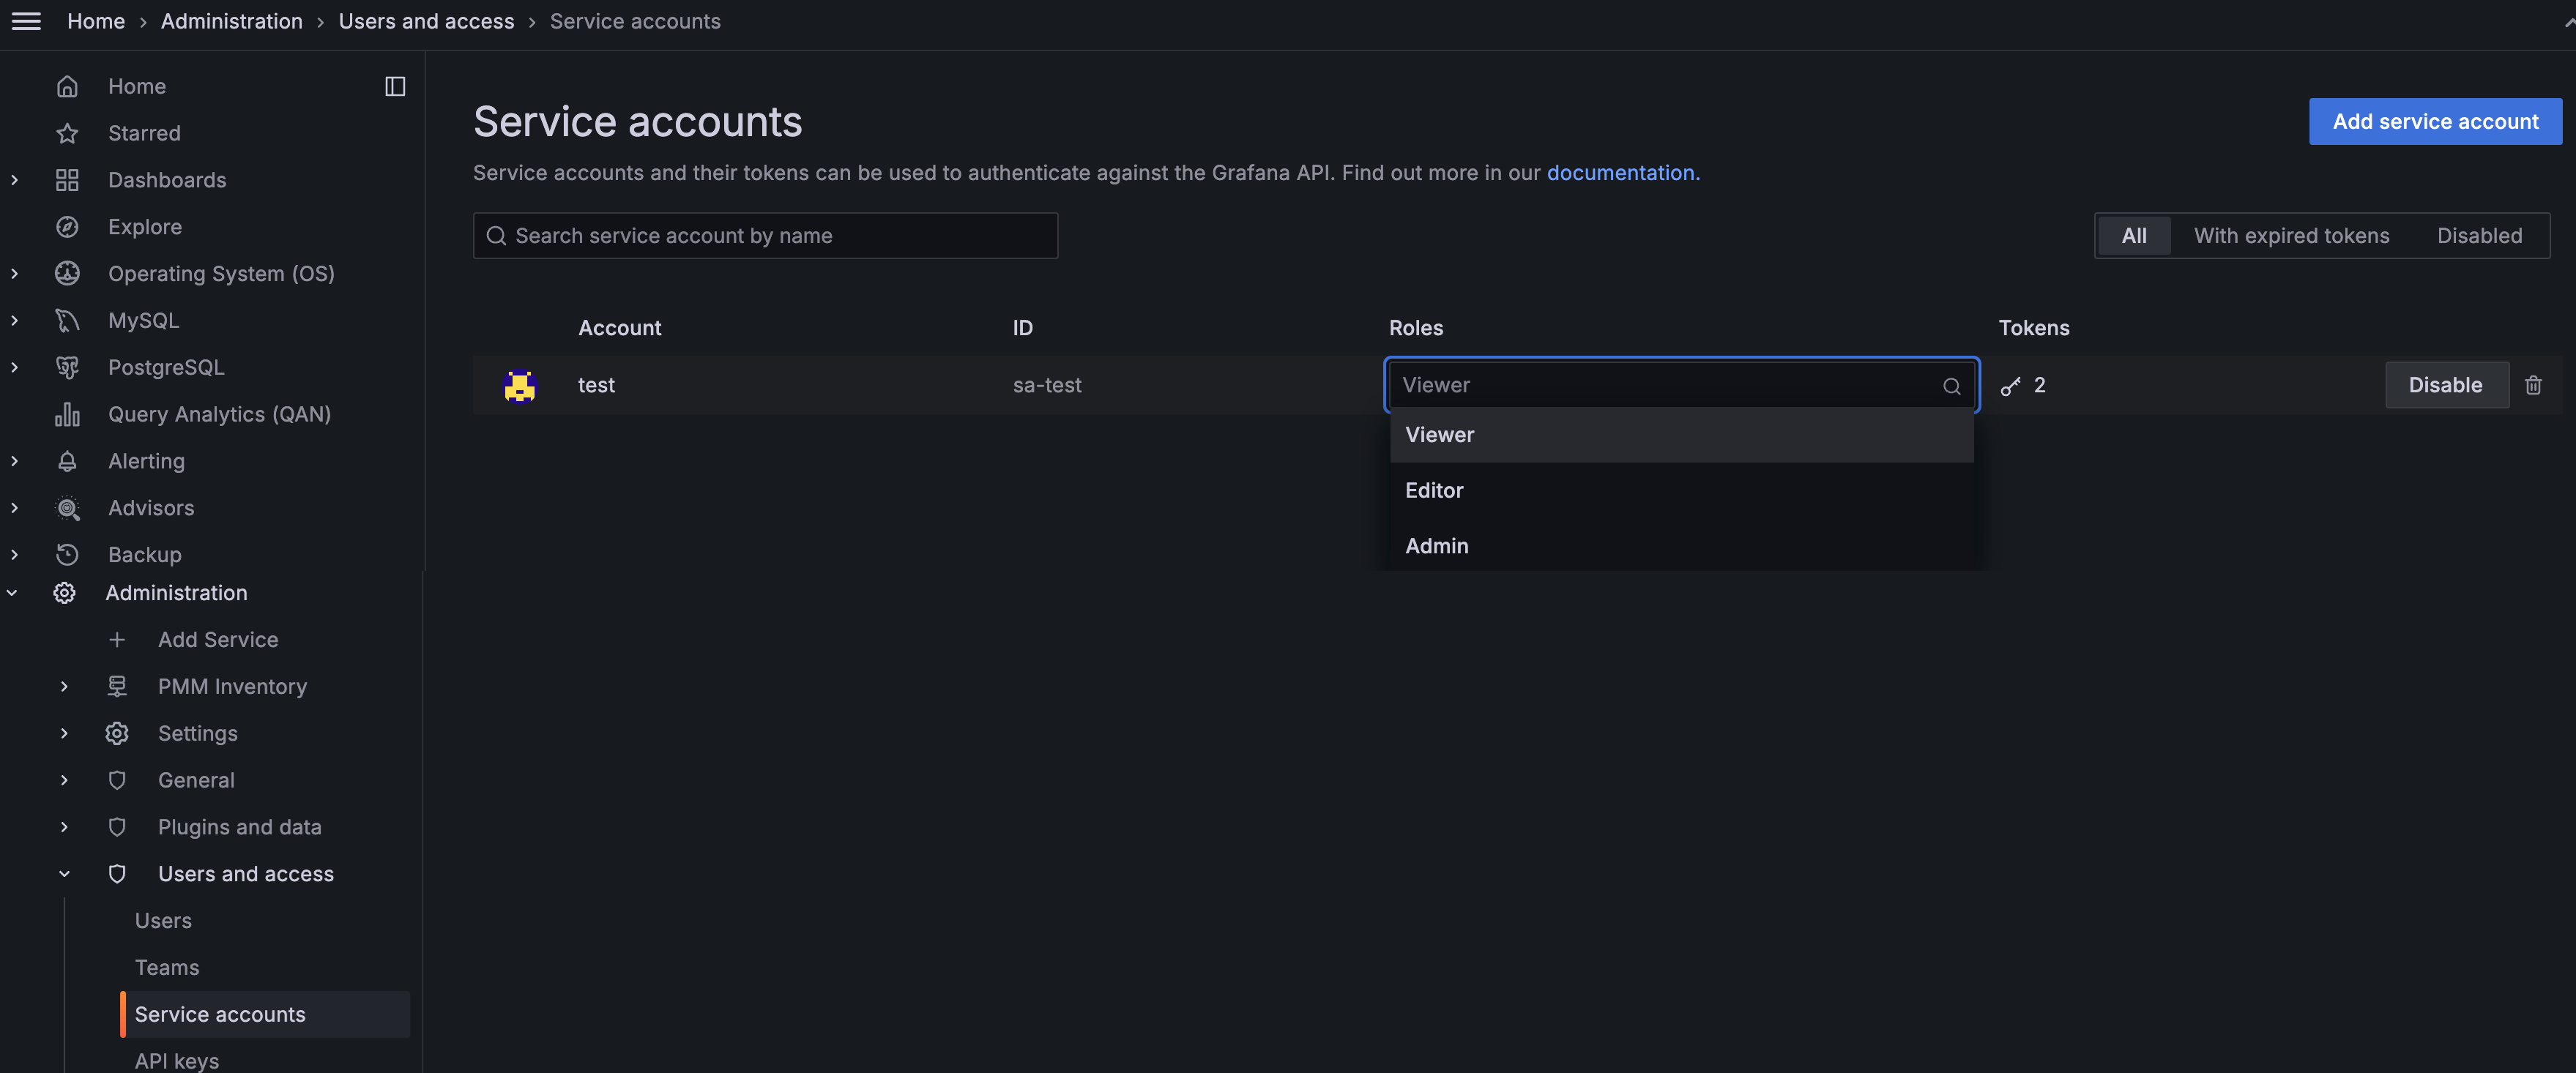
- the keys will appear under Administration > Users and Access > Service Accounts
For more information see Migrate to PMM 2 to PMM 3 and Service account authentication.
CVEs eliminated through architectural changes
The removal of legacy components like Integrated Alerting and DBaaS, combined with the security enhancements above, eliminates multiple potential vulnerabilities and CVEs. This makes PMM 3 our most secure release yet.
Enhanced stability
Containerized PMM architecture for AMI and OVF deployments
Previously, AMI and OVF instances of PMM were created as standalone images rather than being containerized like the primary Docker-based PMM version.
This difference in architecture led to challenges in maintenance as fixes and updates for AMI and OVF instances required additional effort and were sometimes delayed due to their lower adoption rates.
With this update, PMM now uses a unified containerized architecture across all deployment methods. In AMI and OVF environments, PMM components run as Podman-managed containers in rootless mode, eliminating the need for elevated system privileges.
This transition not only aligns AMI and OVF deployments with PMM's core containerized model but also improves security, enables faster troubleshooting, and streamlines updates and patch management.
More stable and quicker upgrades
PMM 3 introduces a significant upgrade system overhaul, replacing the earlier method based on internal package updates. While the previous approach offered the convenience of upgrading directly via the Update button on the Home dashboard, it was prone to connection issues and package corruption, often resulting in complex recovery challenges.
The new upgrade method moves away from RPM updates to exclusive container updates, eliminating RPM-related complications. This streamlined approach provides consistent upgrade experiences across all deployment types — Docker, Podman, and OVF/AMI.
At the same time, we're maintaining the UI upgrade option by integrating Watchtower, an external upgrading tool. When you click the Upgrade Now button on the Home Dashboard, Watchtower seamlessly replaces the PMM Server container and links the new one to the existing volume, preserving all data and settings intact.
For easy adoption, Watchtower comes pre-configured in our Easy-Install script, enabling one-step PMM setup.
Reduced PMM container image size
We've optimized the PMM 3 container image from 3.1GB to 2.6GB, reducing its size by 0.5GB. This reduction improves download speeds and enhances deployment reliability, particularly beneficial for environments with limited storage capacity or bandwidth constraints.
Improved user experience
New upgrade UI
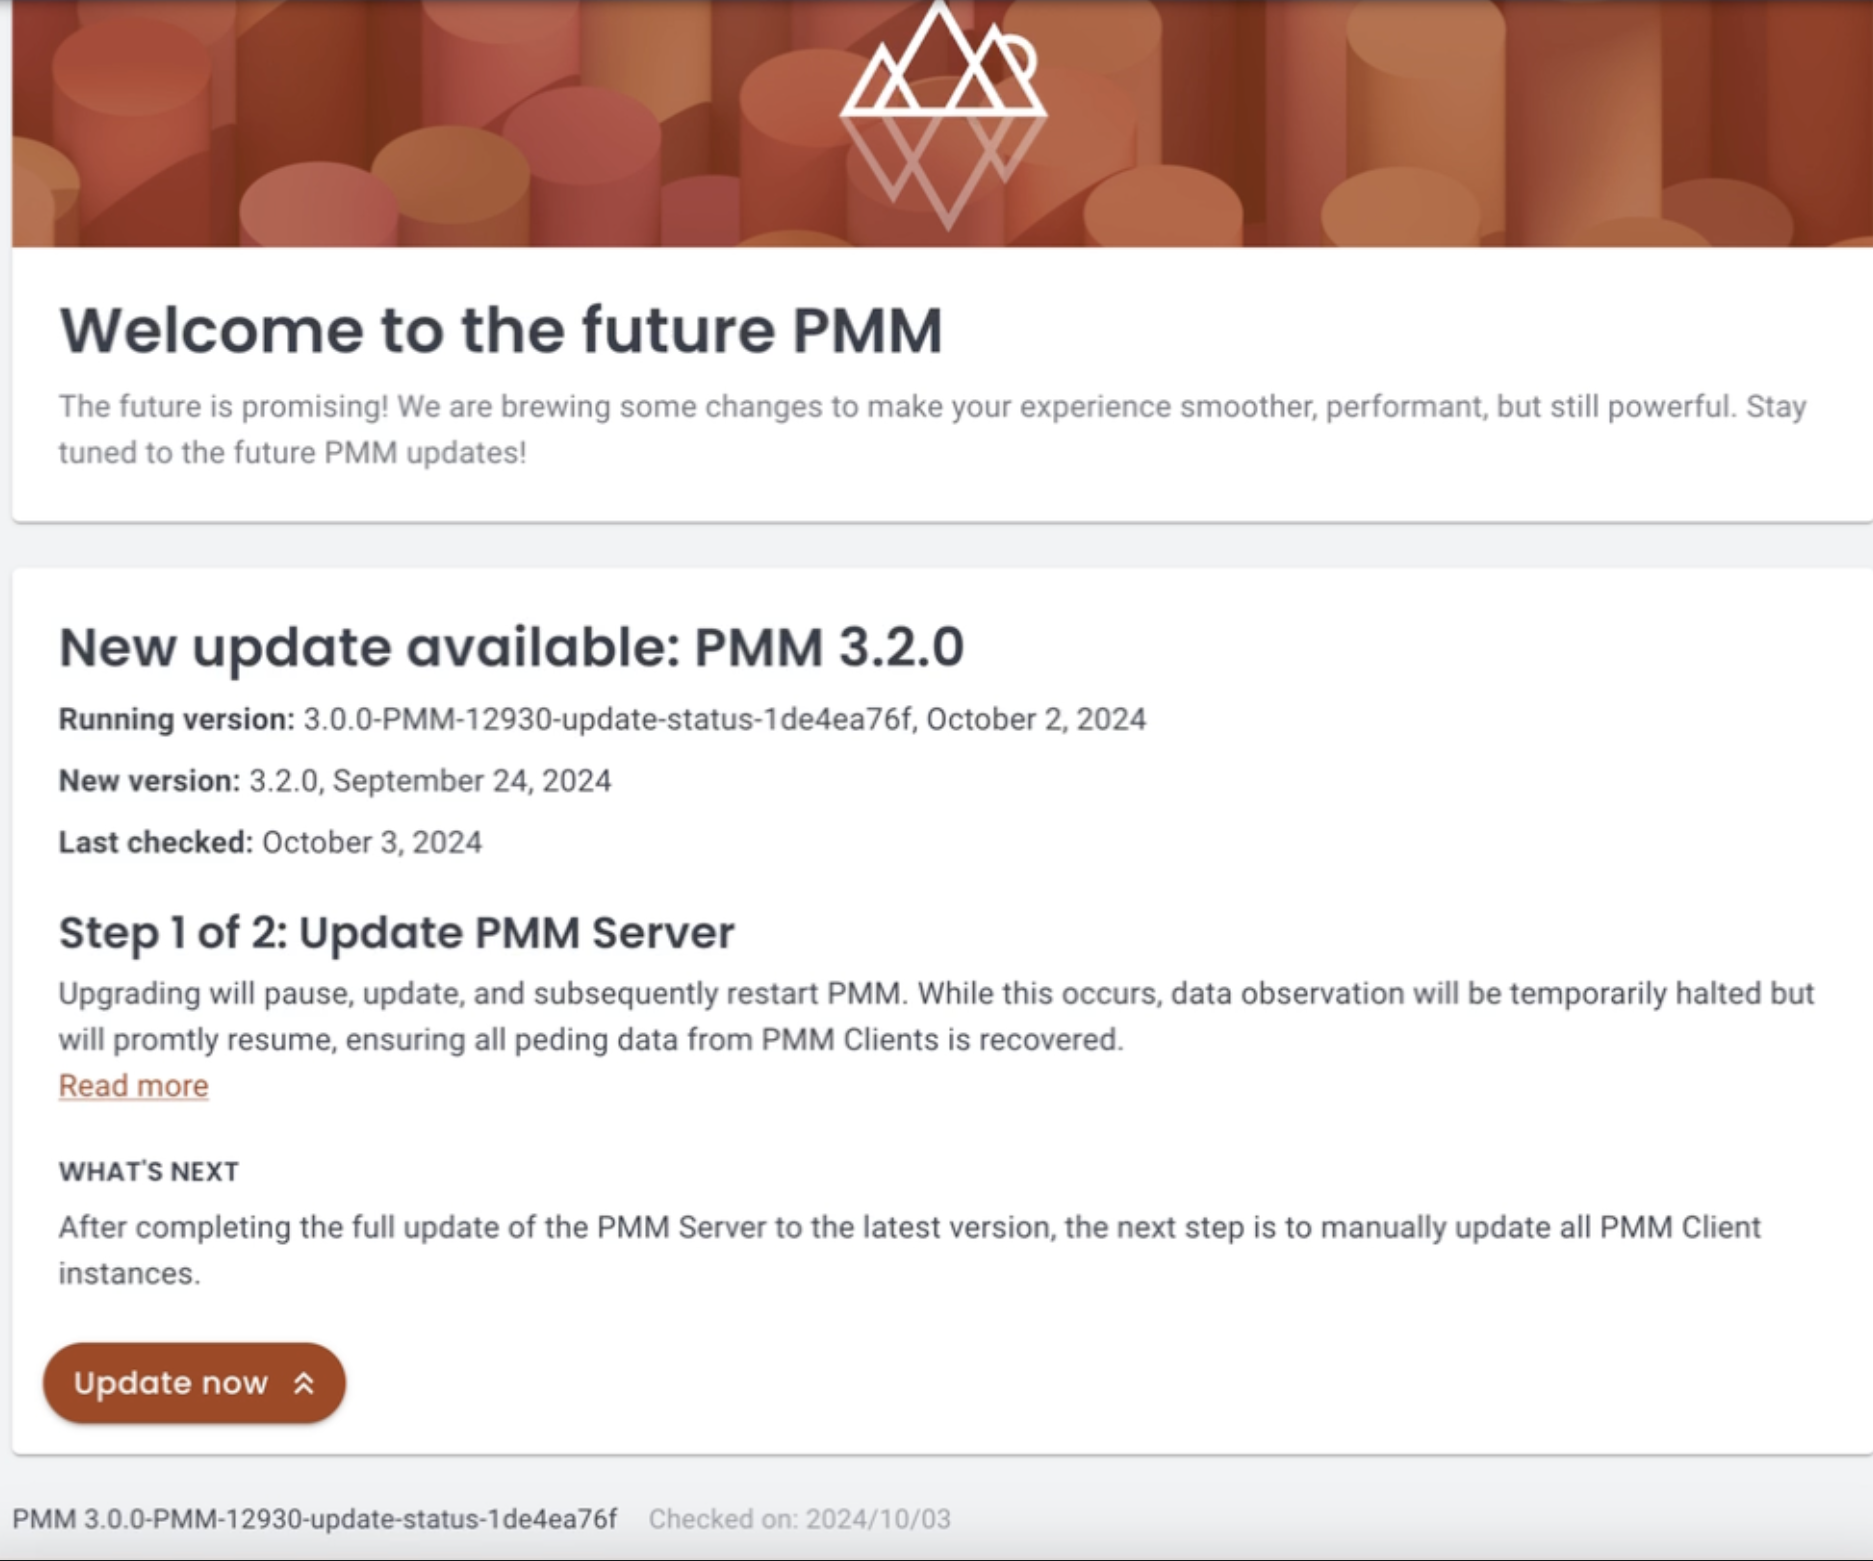
We've introduced a new Updates page under PMM Configuration to support the new container-based upgrade system. This centralized interface offers clear visibility into the versions and configurations of both your PMM Server and Clients, simplifying the update process.
With this update, you'll receive proactive notifications whenever new versions are released to help you make informed decisions before proceeding with available upgrades.
Flexible monitoring configurations
PMM extends its database monitoring setup process by adding an intuitive UI-driven approach alongside CLI-based configuration. After installing PMM Client on your database server, all further monitoring configurations can be managed directly through the PMM interface, eliminating the need for complex command-line operations.
This simplified w...
v2.44.0
Percona Monitoring and Management 2.44.0
| Release date | December 13th, 2024 |
|---|---|
| Installation | Installing Percona Monitoring and Management |
Percona Monitoring and Management (PMM) is an open source database monitoring, management, and observability solution for MySQL, PostgreSQL, and MongoDB.
It enables you to observe the health of your database systems, explore new patterns in their behavior, troubleshoot them, and execute database management operations regardless of whether your databases are located on-premises or in the cloud.
Support for version 8.0 of Percona Server for MongoDB (PSMDB), MongoDB Community, and MongoDB Enterprise
The latest version of MongoDB Community edition, along with the upcoming PSMDB 8.0, introduce numerous improvements and significant performance enhancements.
We have updated PMM 2 to include support for these new versions, including changes to mongodb_exporter to accommodate the revised metrics structure (e.g., wiredTiger.concurrentTransactions is now queues.execution).
The MongoDB Oplog Details dashboard has also been adapted to support MongoDB 8.0's new oplog metrics, with updated panels for Oplog Buffered Operations and Buffer Capacity.
!!! hint alert alert-success "Important notes"
- This enhancement requires PMM Agent version 2.43.1 or later.
- MongoDB 8.0 introduces significant changes to its internal metrics structure. While we have updated PMM’s built-in dashboards to reflect these changes, you may need to update any custom dashboards to align with the new metrics.

- When using the `--enable-all-collectors` flag, monitor memory usage carefully with MongoDB clusters, especially in sharded environments with multiple collections. If you frequently create new collections or work with many collections, disable the `collstats` collector to prevent memory consumption issues.
Improved PostgreSQL 17 metrics collection
PMM 2.44.0 strengthens monitoring capabilities for PostgreSQL 17, building on the recent support for Query Analytics (QAN) introduced in PMM 2.43.2.
This previous release updated field names for PostgreSQL 17 compatibility (e.g., blk_read_time to shared_blk_read_time).
This release further enhances PostgreSQL monitoring with updated queries aligned with PostgreSQL 17's schema changes to ensure accurate metrics collection in the PostgreSQL Instances Overview dashboard.
We've also improved collector support, including proper recognition of PostgreSQL 17 columns like checkpoints_timed in the stat_bgwriter collector.
Fixed metrics collection for MongoDB backups
We've resolved an issue where Percona Backup for MongoDB (PBM) metrics were not being scraped by default and required the --enable-all-collectors flag.
With this fix, PBM metrics are now automatically collected when MongoDB services are added to PMM, without requiring additional configuration.
However, PBM metrics collection is disabled for PMM Clients 2.43.0 and 2.43.1 due to a memory leak identified in these versions. This functionality is supported starting with PMM Client 2.43.2 and later.
v2.43.2
Percona Monitoring and Management 2.43.2
| Release date | October 30th, 2024 |
|---|---|
| Installation | Installing Percona Monitoring and Management |
Percona Monitoring and Management (PMM) is an open source database monitoring, management, and observability solution for MySQL, PostgreSQL, and MongoDB.
It enables you to observe the health of your database systems, explore new patterns in their behavior, troubleshoot them, and execute database management operations regardless of whether your databases are located on-premises or in the cloud.
PostgreSQL 17 support for Query Analytics (QAN)
This patch release adds PostgreSQL 17 support for Query Analytics with updates to the pg_stat_statements and pg_stat_monitor extensions.
To align with PostgreSQL 17 standards, we've renamed the blk_read_time field to shared_blk_read_time and the blk_write_time field to shared_blk_write_time.
All dashboards reflect these changes, and the API supports both old and new field names, for backward compatibility.
Secure Grafana image rendering
PMM Server now supports secure Grafana image rendering capabilities through a dedicated container deployment, providing isolated rendering operations without impacting PMM Server resources.
Previously installed directly within PMM Server, the Grafana Image Renderer plugin now runs in a separate container, offering secure HTTPS communication and custom CA certificate configuration through the PMM API.
To update the plugin installation:
-
Deploy the Grafana Image Renderer container (
grafana/grafana-image-renderer:latest) alongside PMM Server within the same Docker network. -
Configure PMM Server with the following environment variables, where
rendereris the hostname of the Grafana Image Renderer container, andpmm-serveris the hostname of PMM Server within the Docker network:GF_RENDERING_SERVER_URL=http://renderer:8081/renderGF_RENDERING_CALLBACK_URL=https://pmm-server:8443/graph/
Fixed: High memory consumption in MongoDB exporter
We have updated the MongoDB exporter to address a critical issue present in version 2.43.1 where unclosed connections led to increasingly high memory consumption over time.
This resolves the Failed to get PBM configuration error, the users may have encountered as a result of the memory leak, and significantly reduces the rate of increase in total memory allocations.
v2.43.1
Percona Monitoring and Management 2.43.1
| Release date | October 2nd, 2024 |
|---|---|
| Installation | Installing Percona Monitoring and Management |
Percona Monitoring and Management (PMM) is an open source database monitoring, management, and observability solution for MySQL, PostgreSQL, and MongoDB.
It enables you to observe the health of your database systems, explore new patterns in their behavior, troubleshoot them, and execute database management operations regardless of whether your databases are located on-premises or in the cloud.
Fixed issue: PMM 2.43.0 upgrade failure
This release addresses the upgrade failure to PMM 2.43.0 via the UI. The issue affected PMM Servers running versions prior to 2.43.0, where an outdated version of percona-release resulted in a missing percona-telemetry-agent package during the PostgreSQL 14 upgrade process.
Resolution
Upgrading directly to PMM 2.43.1 will bypass this issue entirely.
Workaround for ongoing 2.43.0 upgrades
If you've already initiated an upgrade to 2.43.0 and wish to complete this specific installation, follow the workaround below for Docker installations:
Before retrying the upgrade run docker exec -t pmm-server dnf clean all, then proceed with the 2.43.0 upgrade.
This command refreshes package metadata, resolving dependency issues and allowing the upgrade to proceed smoothly.
v2.43.0
Percona Monitoring and Management 2.43.0
| Release date | September 19th, 2024 |
|---|---|
| Installation | Installing Percona Monitoring and Management |
Percona Monitoring and Management (PMM) is an open source database monitoring, management, and observability solution for MySQL, PostgreSQL, and MongoDB.
It enables you to observe the health of your database systems, explore new patterns in their behavior, troubleshoot them and execute database management operations regardless of whether your databases are located on-premises or in the cloud.
What's new in this release
PMM 2.43 brings a host of updates, including new and redesigned dashboards, new collectors and metrics, enhanced troubleshooting capabilities, strengthened security, and initial steps towards expanded platform support with experimental ARM compatibility for PMM Client.
Additionally, this release features many bug fixes and performance enhancements to improve your user experience.
MongoDB dashboard improvements and GA of recent experimental dashboard
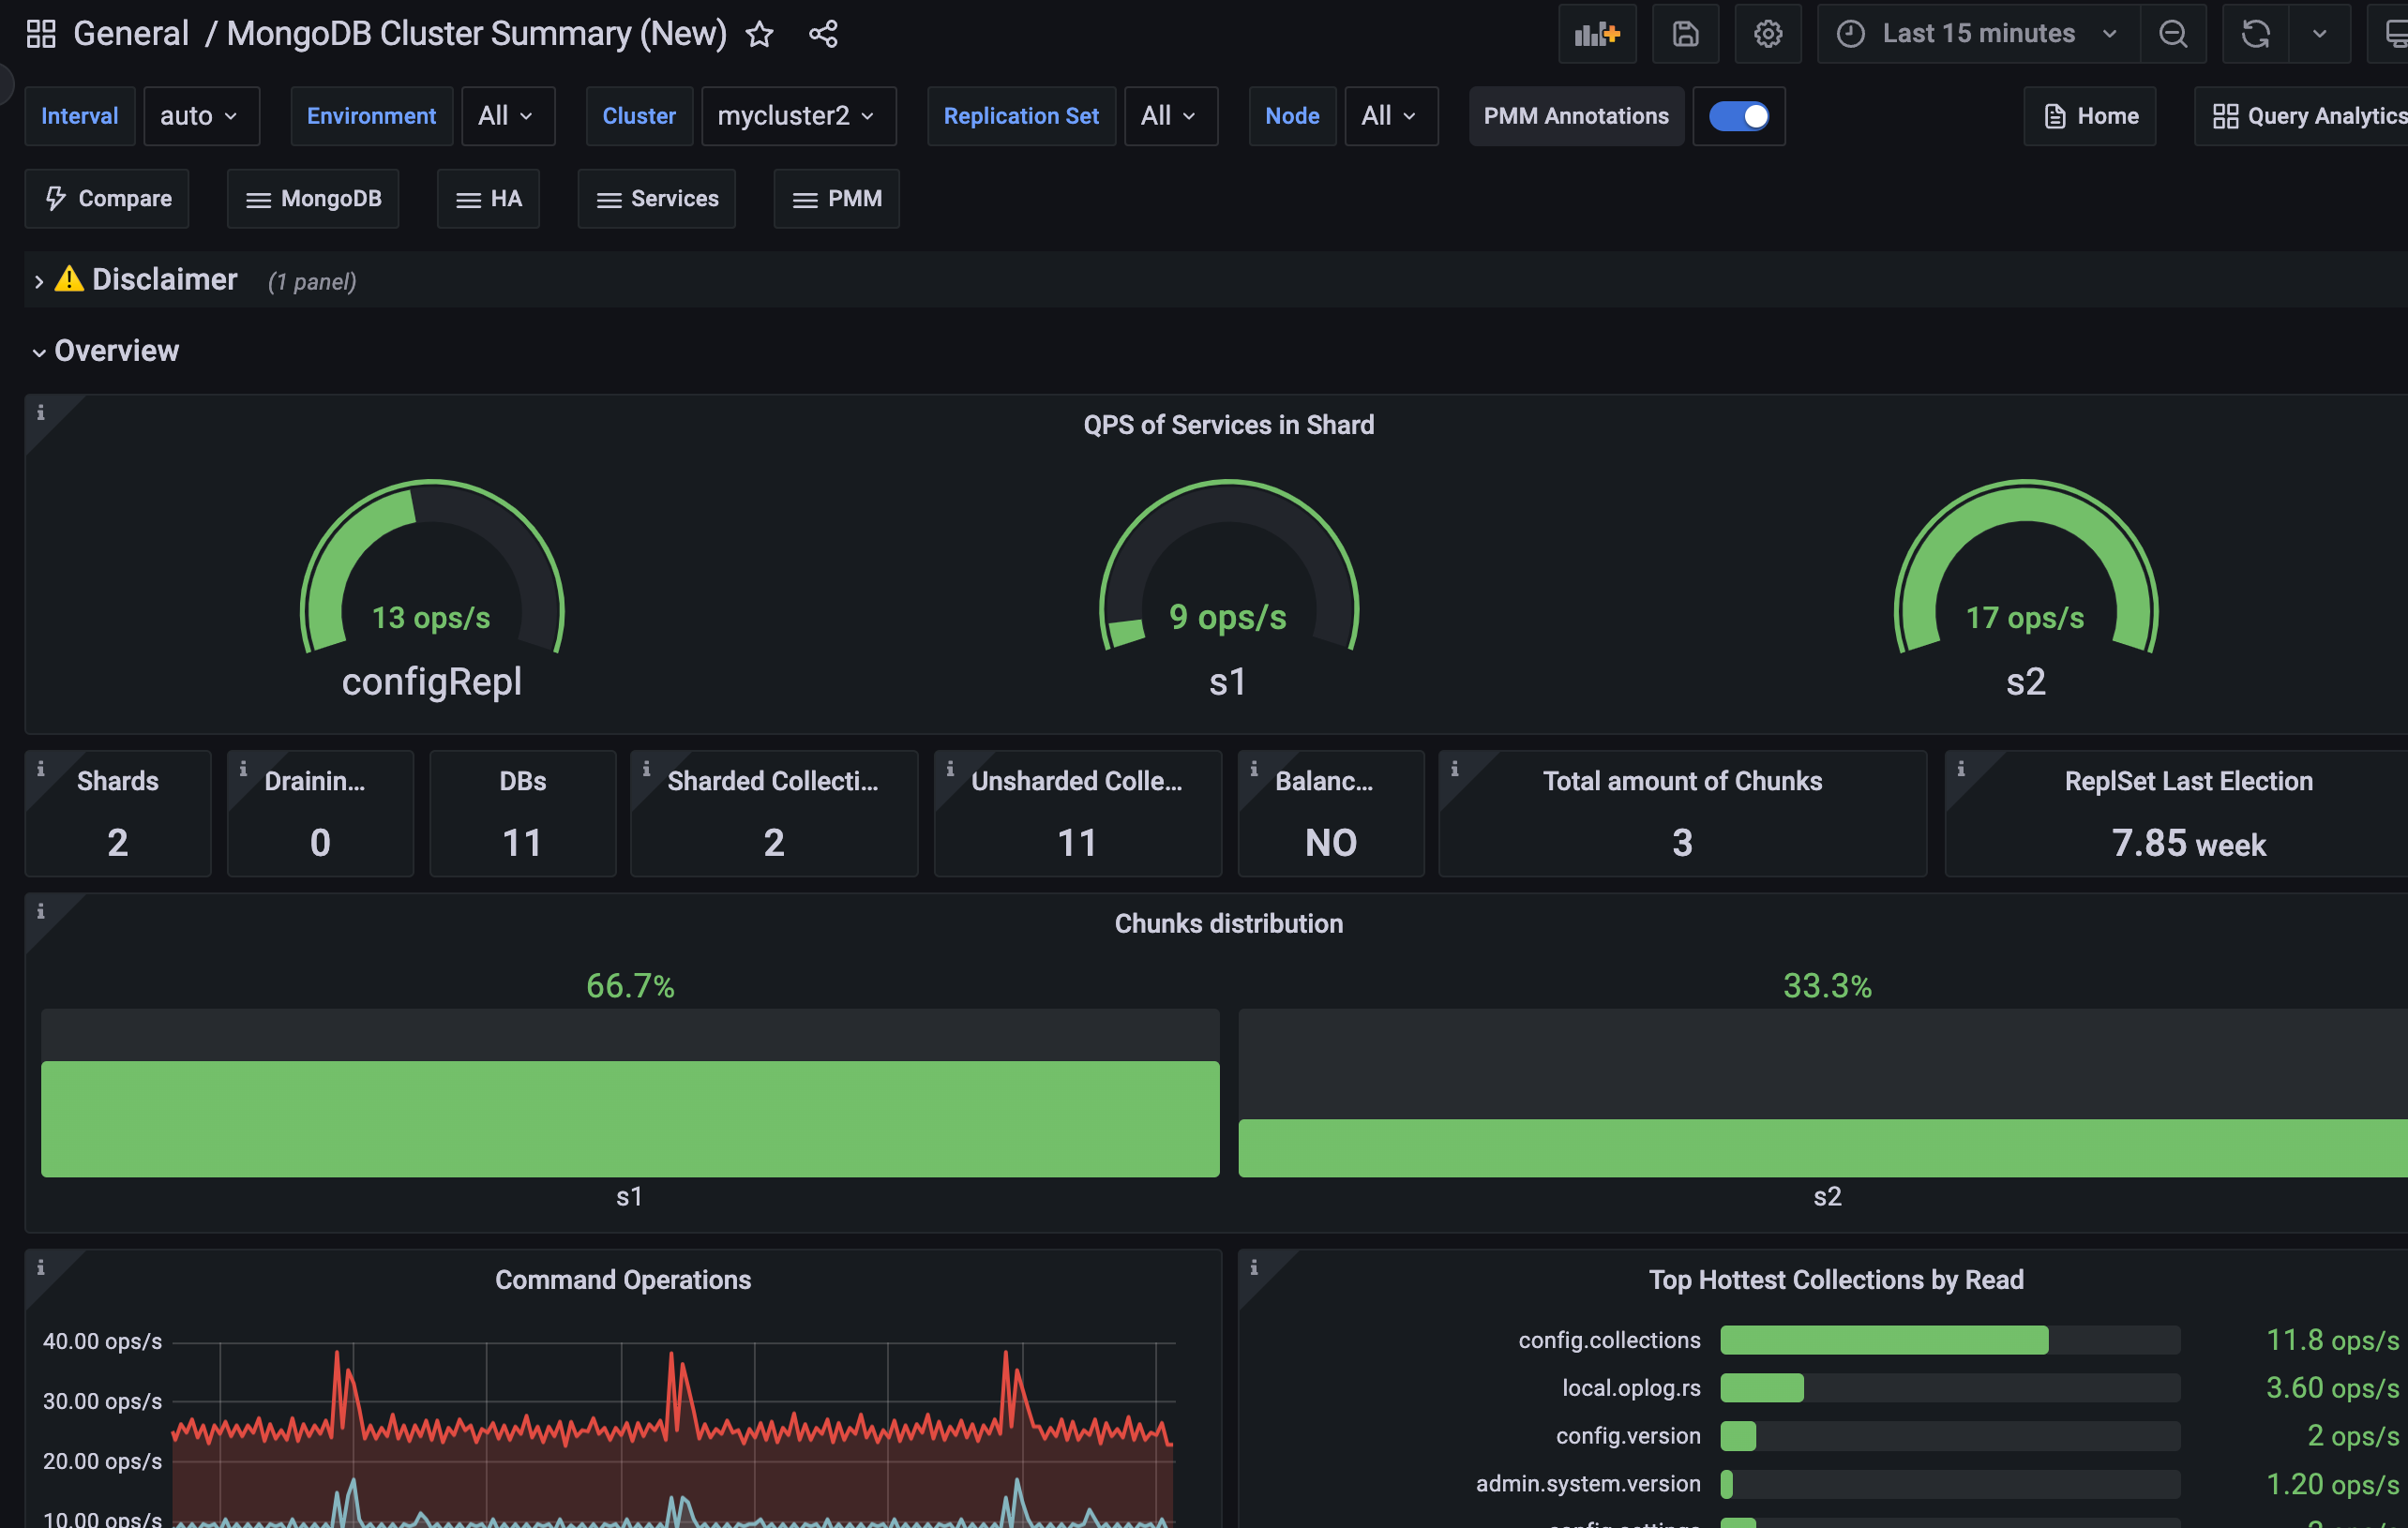
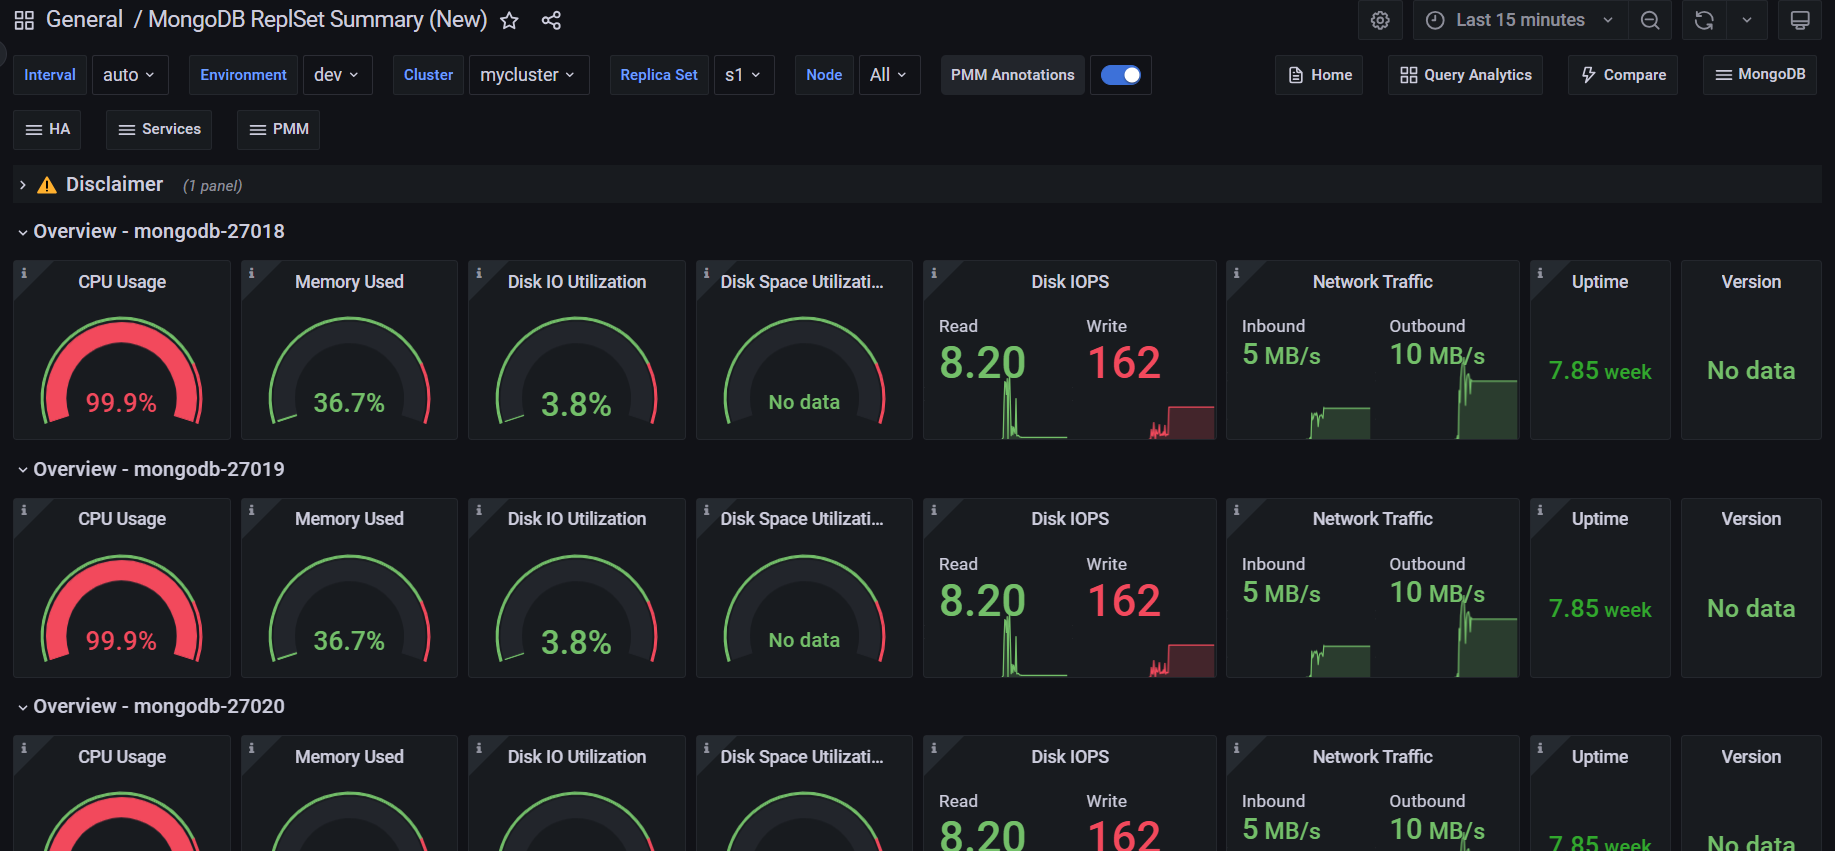
We've made some significant enhancements to MongoDB monitoring, focusing on redesigned dashboards, streamlined navigation, and general availability (GA) of previously experimental dashboards.
Redesigned dashboards
We've overhauled two critical MongoDB dashboards to provide more value, especially for complex, multi-environment setups:
- Replica Set Summary
- Sharded Cluster Summary (formerly Cluster Summary)
These dashboards now offer enhanced usability, improved insights, and optimized visualizations for complex environments.
They focus on highlighting potential database issues for faster resolution and provide centralized, actionable insights without clutter.
General availability of Experimental dashboards
The redesigned dashboards, along with the following previously experimental dashboards, are now generally available:
- MongoDB Oplog Details
- MongoDB Collection Overview
- Replica Set Summary
- Sharded Cluster Summary (formerly Cluster Summary)
📝 Experimental vs. GA
Experimental dashboards are newly developed or redesigned dashboards that are initially released as preview features. Once these dashboards have proven their value and stability, they are transitioned to GA status, which indicates that they are fully stable and ready for general use.
New experimental MongoDB Router Summary dashboard
We've created a new experimental MongoDB Router Summary dashboard to enhance your experience when monitoring MongoS (routers) of MongoDB sharded clusters.
This dashboard provides:
- MongoS availability (UP or DOWN) with a chart showing the state of all MongoS instances, similar to the Replica Set Summary dashboard
- MongoS version
- CPU, Memory, Disk metrics, and much more
To access the new dashboard, go to MongoDB> High availability > Router summary.
Accessing the new dashboards
You can find the updated dashboards in the MongoDB and Dashboards sections of the main menu. They replace the previous versions as the default dashboards for MongoDB monitoring.
The old dashboards have been moved to the Experimental folder and renamed with (Old) appended to their names. Future releases will remove these older versions.
Updated MongoDB menu structure
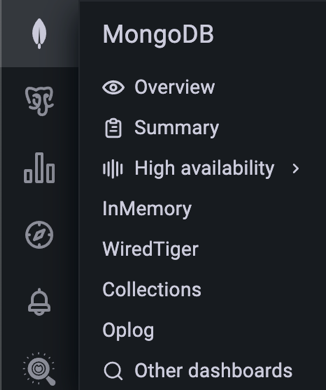
To complement the dashboard improvements, we've also restructured the MongoDB section on the main menu for better navigation and accessibility:
-
reorganized menu for a more intuitive navigation, prioritizing the two updated GA dashboards above.
-
decluttered view by moving older dashboards to the Experimental folder or removing them from the menu.
-
added MongoDB Instance Summary, Collection Overview and MongoDB Oplog Details the main menu:
We encourage you to start using the new dashboards to benefit from their enhanced monitoring capabilities. We also invite you to share your feedback in the PMM forum so we can continue to improve them.
New MongoDB collector: CurrentOp
The MongoDB exporter now includes the CurrentOp collector, offering visibility into active operations, including the new mongodb_currentop_query_uptime metric.
To start the MongoDB exporter with the CurrentOp collector enabled, use the --enable-all-collectors flag when adding MongoDB services to your PMM instance:
pmm-admin add mongodb --enable-all-collectors ...Specifying a limit with --max-collections for this collector is not necessary.
For more information on MongoDB collectors and metrics, see the pmm-admin commands documentation.
Note
Operation collection limitation
To minimize impact on disk usage, the CurrentOp collector is designed to collect only operations that have been running for longer than 1 minute. This limitation helps focus on potentially problematic long-running operations while keeping data volume manageable.
Monitoring Percona Backup for MongoDB (PBM)
PMM now supports monitoring Percona Backup for MongoDB (PBM) setups through a dedicated collector in the MongoDB exporter, providing key insights into pbm-agent statuses, PITR configuration, and backup statuses.
New metrics for this include:
-
mongodb_pbm_cluster_backup_configured: indicates if PBM is configured for the cluster (1 = configured, 0 = not configured). -
mongodb_pbm_agent_status: shows the status of each PBM agent connected to the cluster nodes (0 = functioning, ≥1 = down, e.g., 2 for unreachable agents). -
mongodb_pbm_cluster_pitr_backup_enabled: specifies whether PITR is enabled in the current PBM configuration (1 = enabled, 0 = not enabled). -
mongodb_pbm_backup_size_bytes: displays the size of each backup in PBM's history, with labels for operation ID (opid), status (status), and backup name (name). -
mongodb_pbm_backup_duration_seconds: shows the duration of each PBM backup operation, using the same labels asmongodb_pbm_backup_size.
These metrics are enabled by default, so if you’re already using PBM, you’ll automatically start receiving them. To access them, go to Explore > Metrics, search for mongodb_pbm, and run your query.
This is just the beginning! While you can create custom dashboards with these metrics, we’re developing dedicated PBM dashboards for a quick overview of your backup status, along with alert templates to help you proactively monitor your PBM setup.
Improved troubleshooting
We've enhanced PMM's troubleshooting capabilities to provide you with better insights and more efficient problem-solving tools:
Enhanced PMM Server logs
The default number of log lines for each log file returned by https://<pmm-server>/logs.zip endpoint has been increased from 1,000 to 50,000.
Additionally, the endpoint now includes a customizable line-count parameter in the download URL, allowing you to specify a custom number of log lines or opt for unlimited log size. For more information, see the API documentation.
Streamlined Kubernetes diagnostics
New PMM Client Docker images now include essential troubleshooting tools:
tarenables easier file transfer in and out of containers using thekubectl cpcommand.curlallows direct checking of exporters to verify their proper functioning.
Improved security
This update addresses several security issues related to the GNU C Library (Glibc), specifically affecting the Name Service Cache Daemon (nscd). Additionally, it resolves multiple security vulnerabilities by upgrading various third-party packages.
Important changes to PMM Update process
To ensure you can access the most up-to-date and secure versions, we've implemented two key changes to the update process:
Transition to a dedicated repository
Since July 1st 2024, PMM updates are distributed exclusively through the dedicated repo.percona.com/pmm2-client repository.
To smoothly transition to this repository and verify that your system is correctly configured, download and run our automated script from GitHub: check_percona_packages.py.
For detailed instructions and more information about this change, read our recent blog post Ensure the Correct Repositories are Enabled for Percona Packages and updated installation instructions.
Update process for older PMM versions
If you’re using PMM version 2.38 or earlier, you might encounter issues when updating to the latest version via the UI Update button. These issues arise due to Red Hat's discontinuation of CentOS 7 repositories, which impacts PMM installations based on CentOS 7.
To ensure your PMM installation continues to receive updates and transitions smoothly away from the discontinued CentOS 7 base:
- for Docker instances: perform a one-time [Docker update](h...
v2.42.0
Percona Monitoring and Management 2.42.0
| Release date | June 11th, 2024 |
|---|---|
| Installation | Installing Percona Monitoring and Management |
Percona Monitoring and Management (PMM) is an open source database monitoring, management, and observability solution for MySQL, PostgreSQL, and MongoDB.
It enables you to observe the health of your database systems, explore new patterns in their behavior, troubleshoot them and execute database management operations regardless of whether your databases are located on-premises or in the cloud.
What's new in this release
This release introduces support for Ubuntu 24.04, configurable metrics resolutions per service, improved connection management for PostgreSQL and PMM Agent, and experimental dashboards for PMM self-monitoring and MongoDB.
The release also brings enhancements to MySQL Query Response Time Details, adds new metrics and labels for PostgreSQL, and addresses several issues related to MongoDB monitoring, upgrades, and Query Analytics and High Availability documentation.
Experimental dashboards in PMM are new or redesigned dashboards that are released as a preview feature for you to test and provide feedback, as we hope to include them as defaults in a future release.
Keep in mind that these dashboards are not considered fully stable or complete, and their design, functionality, and metrics may change in future releases based on user feedback and further development.
Release highlights
Ubuntu 24.04 Noble Numbat support
PMM now officially supports monitoring of databases running on the recently released Ubuntu 24.04 Noble Numbat operating system.
With this addition, PMM continues to provide comprehensive coverage across a wide range of Linux distributions commonly used in database deployments.
Check the full list of supported platforms on the Percona Software Support Lifecycle webpage.
For information on installing the PMM Client on Linux, see Set up PMM Client.
Configurable metrics resolutions per service
You can now configure metrics resolutions on a per-service basis by setting Low-Resolution (LR), Medium-Resolution (MR), and High-Resolution (HR) settings for each exporter individually.
Customizing the resolution settings for individual services means that you can fine-tune your PMM setup to balance data granularity and resource consumption. This will enable you to:
- allocate resources efficiently by focusing on high-resolution data for key services
- reduce storage requirements by adjusting resolution for less critical components
- align your monitoring setup with the specific needs of your environment
This feature is currently accessible via the PMM API and will be integrated into the user interface in a future release.
API call example:
  curl --request POST \
      --url https://<your-pmm-address>/v1/inventory/Agents/ChangePostgresExporter \
      --header 'accept: application/json' \
      --header 'content-type: application/json' \
      --data '
  {
  "common": {
      "metrics_resolutions": {
      "hr": "60s",
      "mr": "300s",
      "lr": "3600s"
      }
  },
  "agent_id": "<agent-id>"
  } '
Improved connection management for PostgreSQL Services and pmm-agent
PMM now offers enhanced connection management capabilities for PostgreSQL services and the PMM Agent, to optimize resource utilization and prevent potential performance issues caused by excessive connections.
PostgreSQL services
When adding a new PostgreSQL services, you can now set a maximum limit on the number of connections that the PostgreSQL exporter can open to the same PostgreSQL instance.
This feature, previously available only through the CLI, is now also accessible through the PMM web interface as well:
- PostgreSQL service: PMM Configuration > Add Service > PostgreSQL > Configuring PostgreSQL Service
- RDS PostgreSQL service: PMM Configuration > Add Service > Amazon RDS > Discover with Amazon Credentials > RDS PostgreSQL
By setting a maximum connection limit, you can prevent excessive connections during concurrent operations, and ensure that connections are closed promptly to avoid idle connections.
When adjusting the maximum number of connections, consider the following:
- higher values might be needed for larger or busier instances.
- setting the limit too high can impact performance.
- if no limit is specified or the option is disabled, the server will manage the connection limits automatically.
PMM Agent
Similarly, you can now limit the number of connections that the PMM Agent opens to monitored databases for QAN, Advisors, and other systems.
Starting with this release, pmm-agent tracks all required resources (primarily connections), and opens no more than two connections per database instance simultaneously.
You can change this default value by setting a parameter or environment variable when starting the pmm-agennt.
For more information on configuring the PMM Agent and available parameters, see the PMM Agent help documentation by running pmm-agent --help.
Experimental PMM self-monitoring dashboard
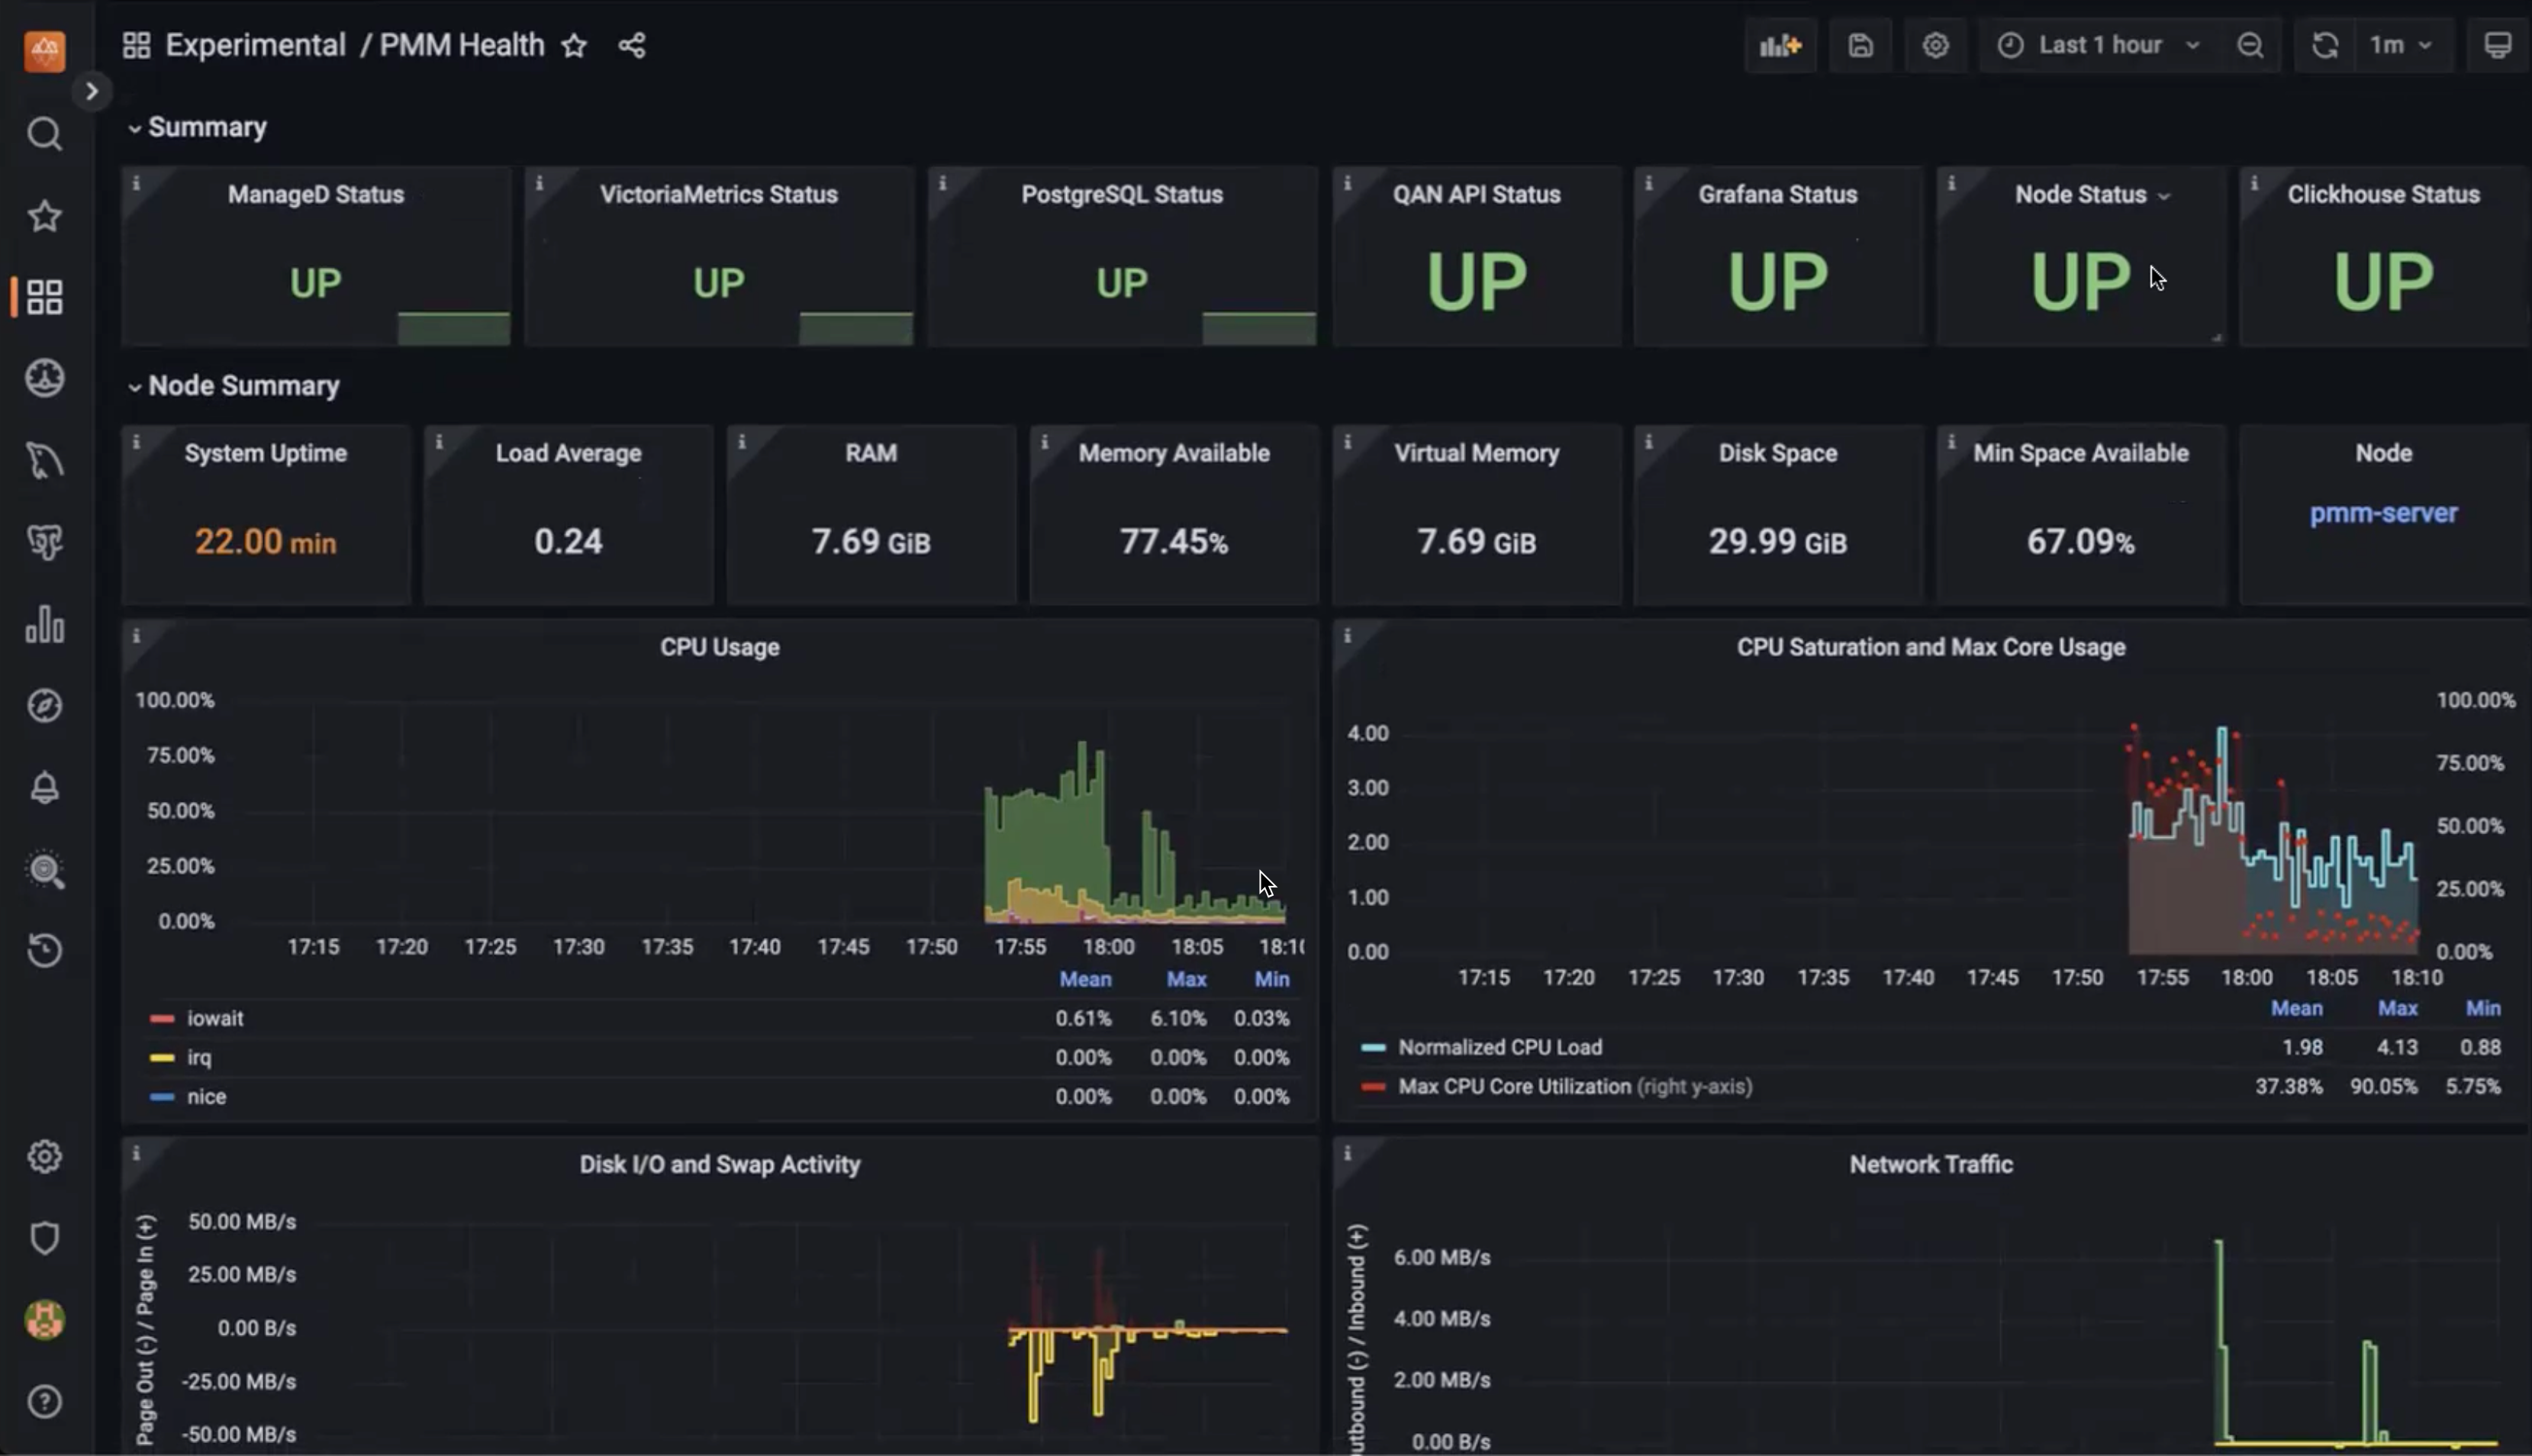
We've added a new experimental PMM Health dashboard to provide detailed insights into the health and performance of PMM itself.
The dashboard reflects the PMM architecture and covers key components such as overall component status, node health, Query Analytics, PMM-managed, Grafana, VictoriaMetrics, ClickHouse, and PostgreSQL metrics.
This initial version is available in the Experimental folder after updating PMM and contains a starter set of key metrics to help identify potential issues and ensure optimal operation.
For more information about this new dashboard, see the Keeping an eye on the eye blog post.
Experimental MongoDB dashboards: Sharded Cluster and Replica Set
Along with the PMM Health Dashboard, we're also introducing experimental updates to two key MongoDB dashboards: the Cluster Summary and ReplicaSet dashboards. These new versions, accessible from the MongoDB section within PMM, have been redesigned to address feedback regarding readability and data density.
The design and navigation are simplified here, to focus on the essential parameters and metrics most relevant to MongoDB performance monitoring.
We encourage you to explore these experimental dashboards and provide feedback in the PMM forum to help us refine them.
Improvements
-
PMM-3303 - We've introduced an experimental PMM Health dashboard in the Experimental folder, offering detailed insights into PMM's health and performance by covering key components such as node health, Query Analytics, Grafana, VictoriaMetrics, ClickHouse, and PostgreSQL metrics.
-
PMM-13123 - Enhanced the Query Response Time Distribution graphs in the MySQL Query Response Time Details dashboard to provide more granular insights into query performance. Previously, the graphs did not include buckets for queries with response times less than 100 milliseconds, the range which many queries typically fall into. This limitation made it difficult to analyze the performance of sub-100ms queries, especially those in the sub-1ms range.
-
PMM-13075 - Added support for Ubuntu 24.04 support.
-
PMM-12896, PMM-12895, PMM-12971 - Added per-database metrics collection and control of parameters, enabling more granular data gathering without overusing connections.
-
PMM-12994 - Added labels to the
pg_replication_slot_slot_is_activeandslot_current_wal_lsnmetrics in the postgres_exporter to identify the replication type (logical or physical) and the plugin used for the slot. -
PMM-12753 - Added experimental versions of the MongoDB Cluster Summary and ReplicaSet dashboards with a streamlined design and simplified navigation, focusing on essential metrics for monitoring MongoDB performance.
-
PMM-11583 - Added support for the
innodb_redo_log_capacityvariable introduced in MySQL 8.0, ensuring accurate and consistent data representation in the InnoDB Logging graphs. -
PMM-11278 - Improved the Query Analytics documentation to explain how QAN collects data. For more information, see the Query Analytics under the hood section in the [Query Analytics topic](https://docs.percona.com/percona-monitoring-and-management/get-started/qu...
v2.41.2
Percona Monitoring and Management 2.41.2
| Release date | March 20th, 2024 |
|---|---|
| Installation | Installing Percona Monitoring and Management |
Percona Monitoring and Management (PMM) is an open source database monitoring, management, and observability solution for MySQL, PostgreSQL, and MongoDB.
It enables you to observe the health of your database systems, explore new patterns in their behavior, troubleshoot them and execute database management operations—regardless of whether your databases are located on-premises or in the cloud.
Release highlights
Debian 12(Bookworm) pmm-client packages
Starting with PMM 2.41.2, we now offer pmm-client packages for the latest version of Debian. You can install these packages by following the instructions in our documentation.
Experimental dashboards
!!! warning "warning"
These experimental dashboards are subject to change. It is recommended to use these dashboards for testing purposes only.
As part of PMM 2.41.2, we have added the following experimental dashboards.
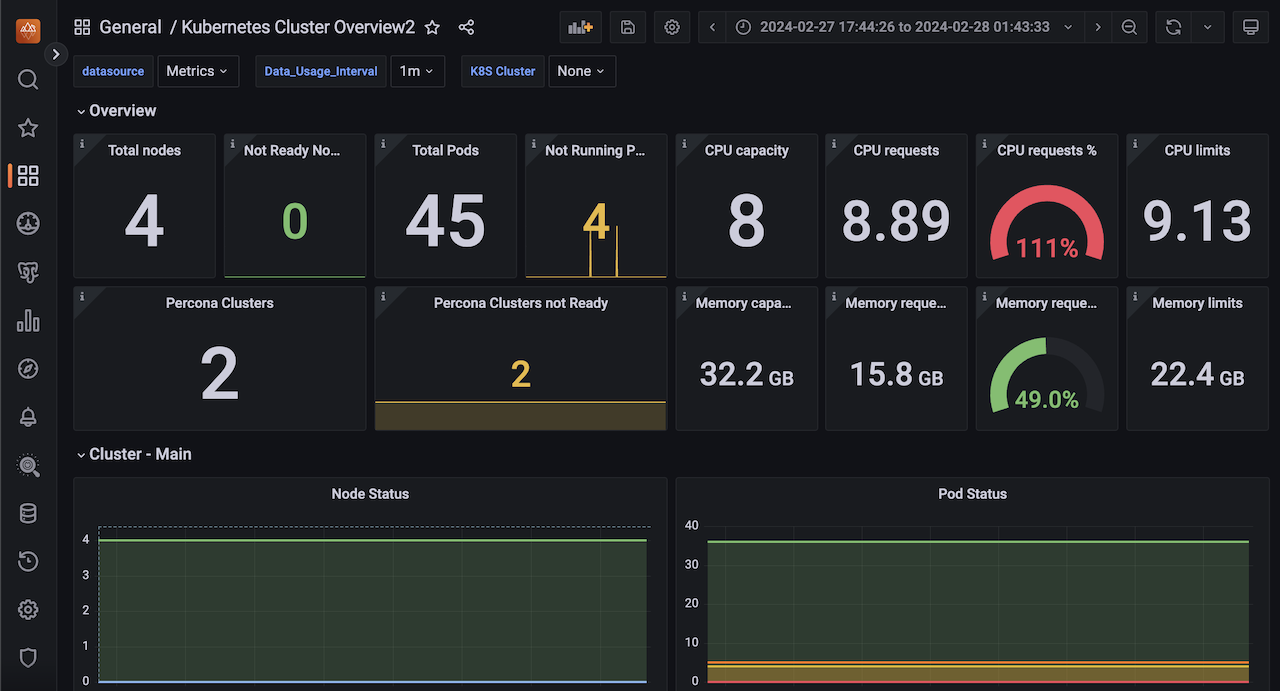
- Reworked Kubernetes dashboards
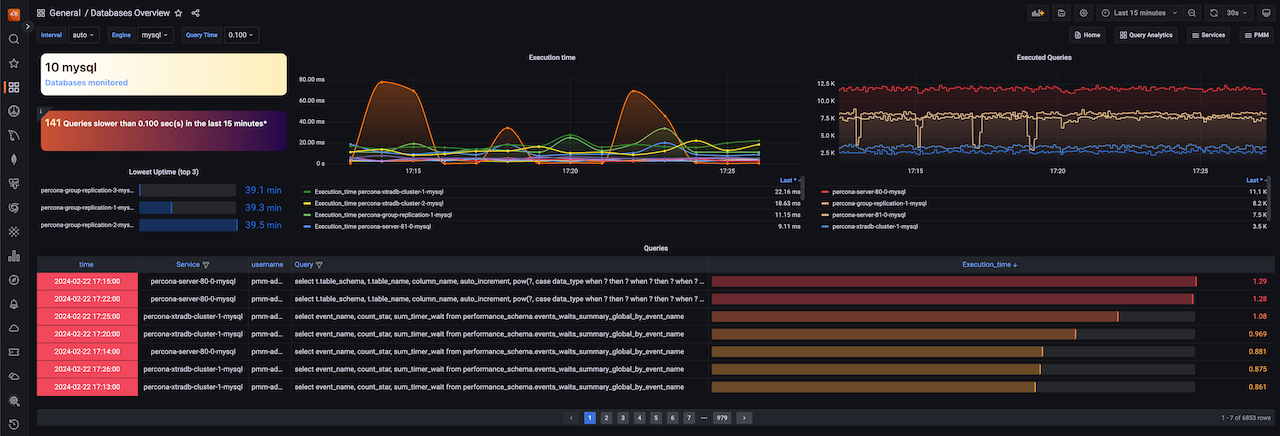
- Databases overview dashboard
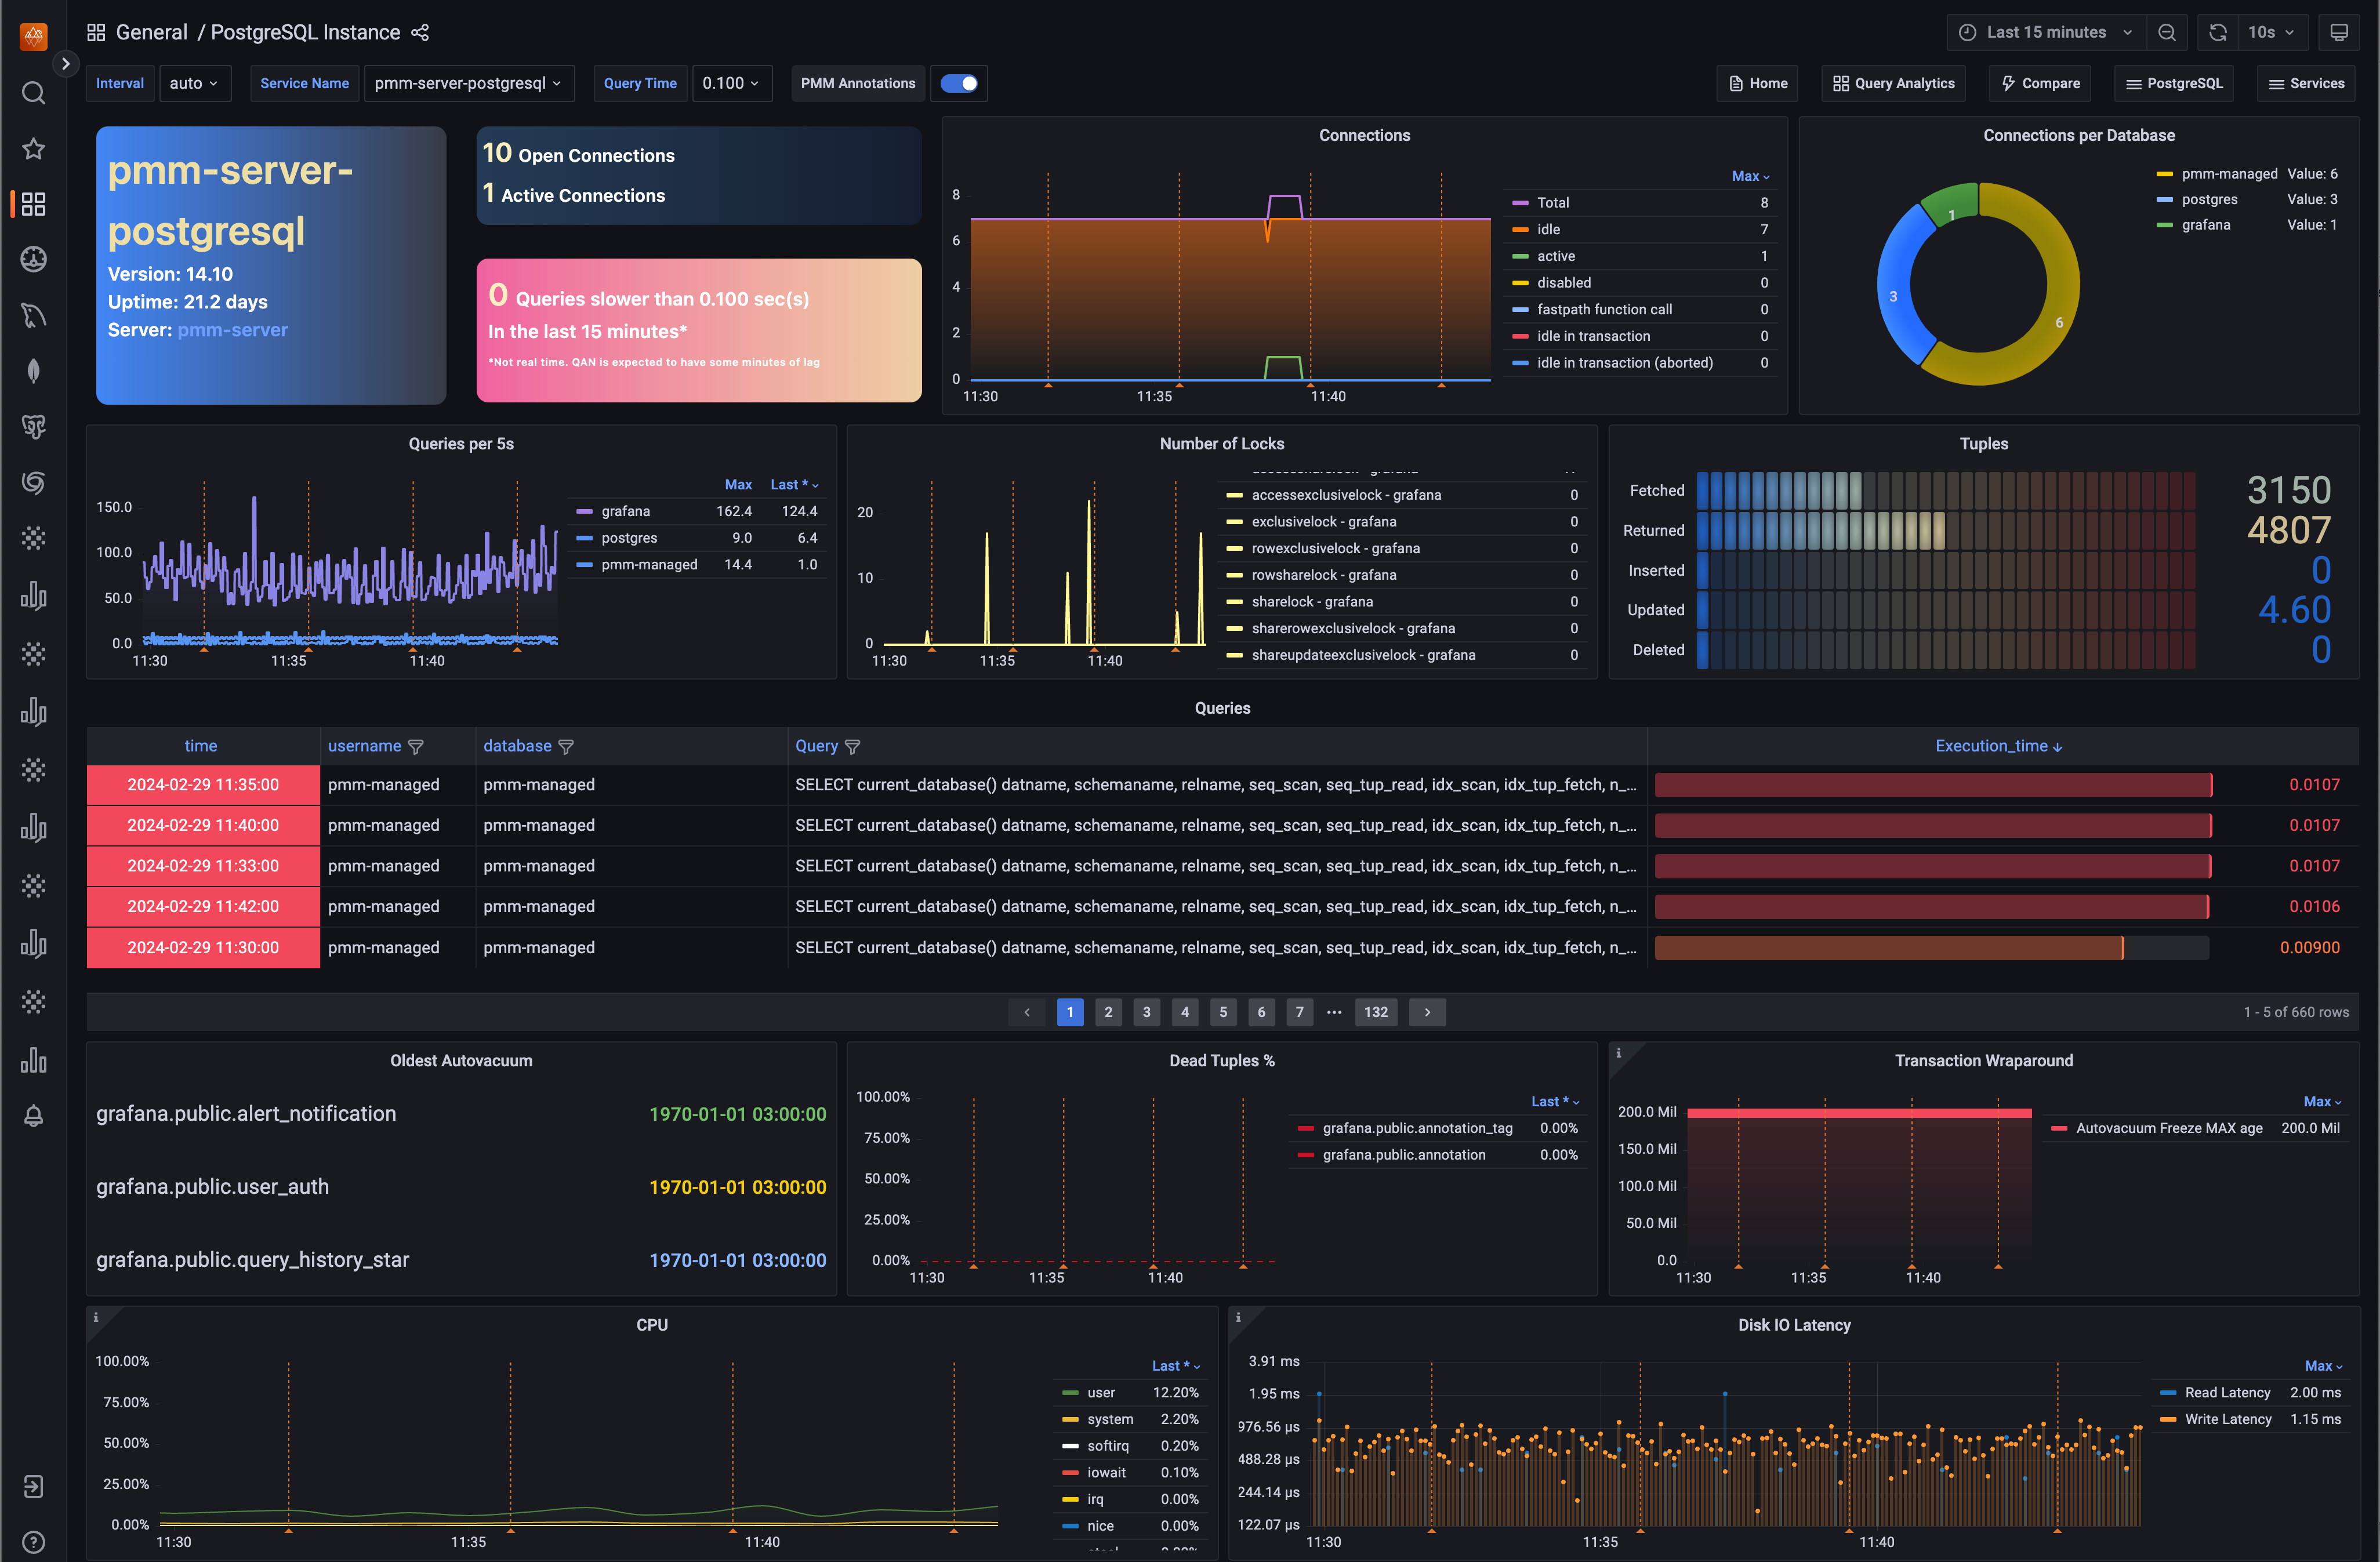
- PostgreSQL Instance Summary dashboard
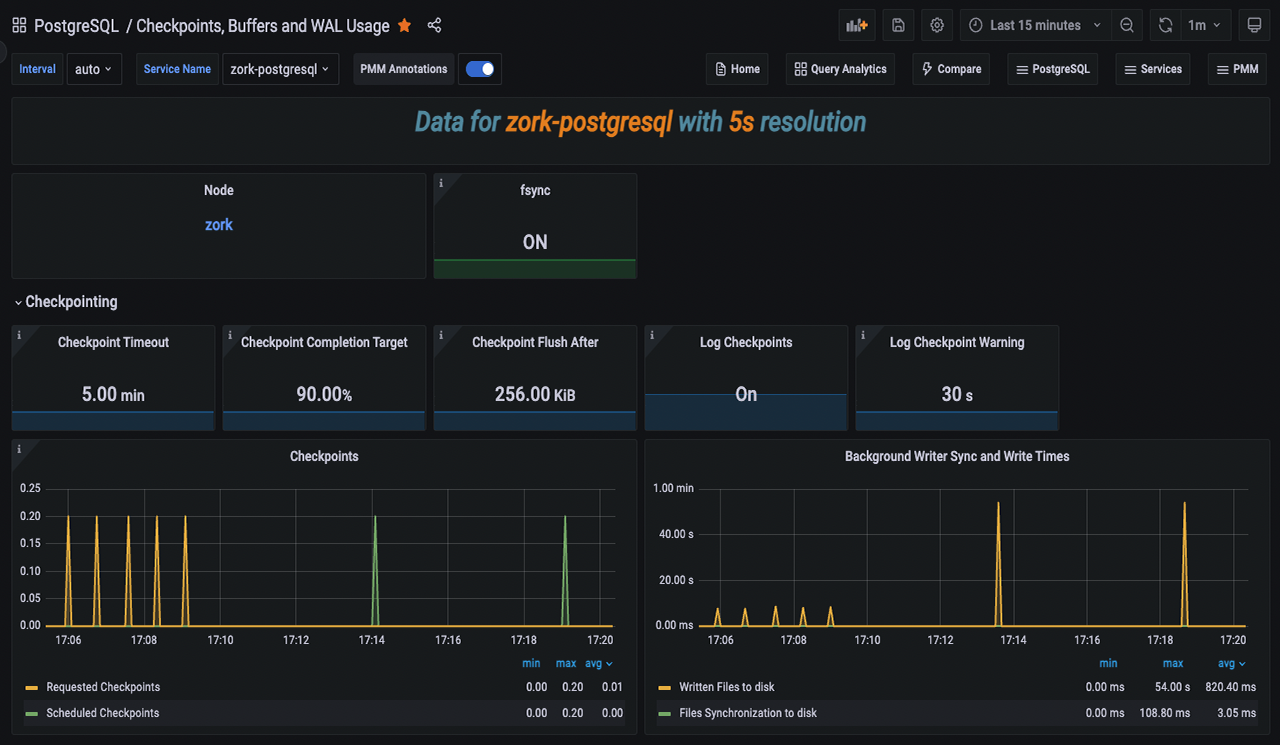
- PostgreSQL Checkpoints, Buffers and WAL Usage dashboard
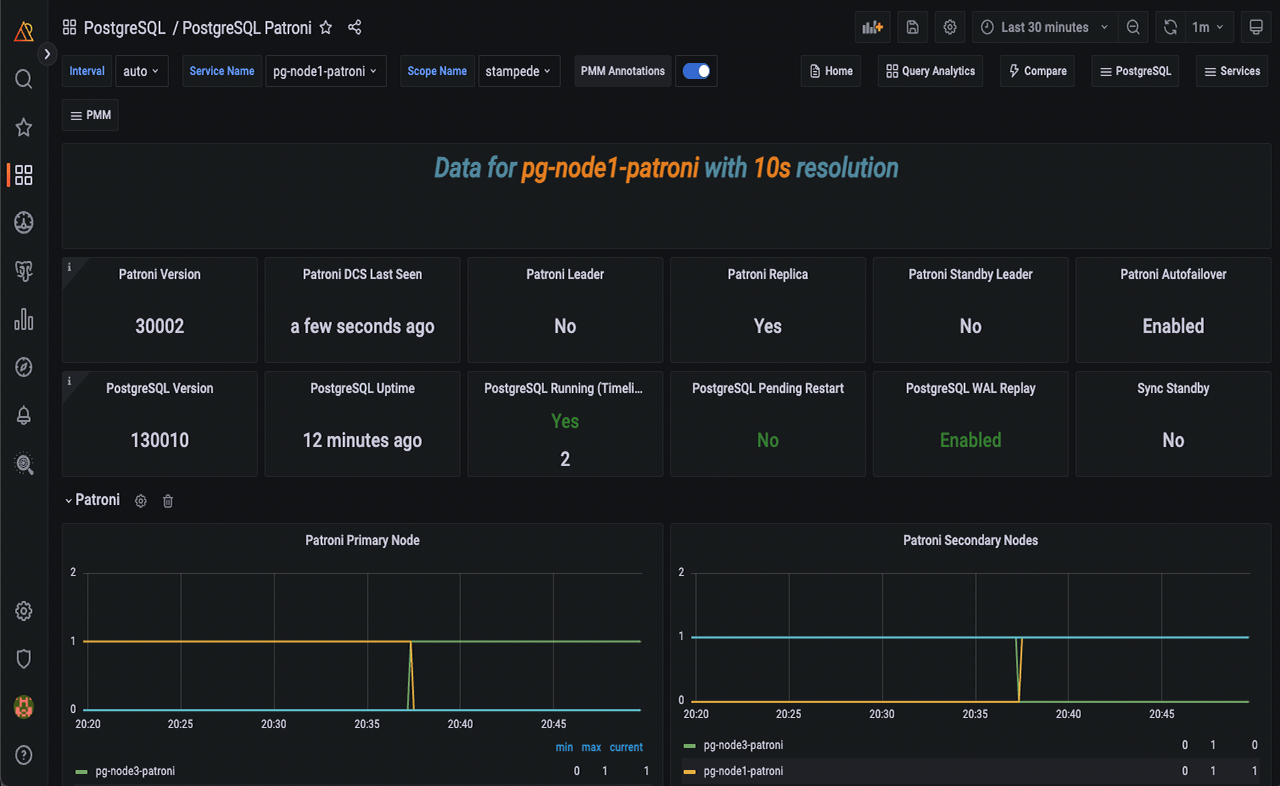
- PostgreSQL Patroni dashboard
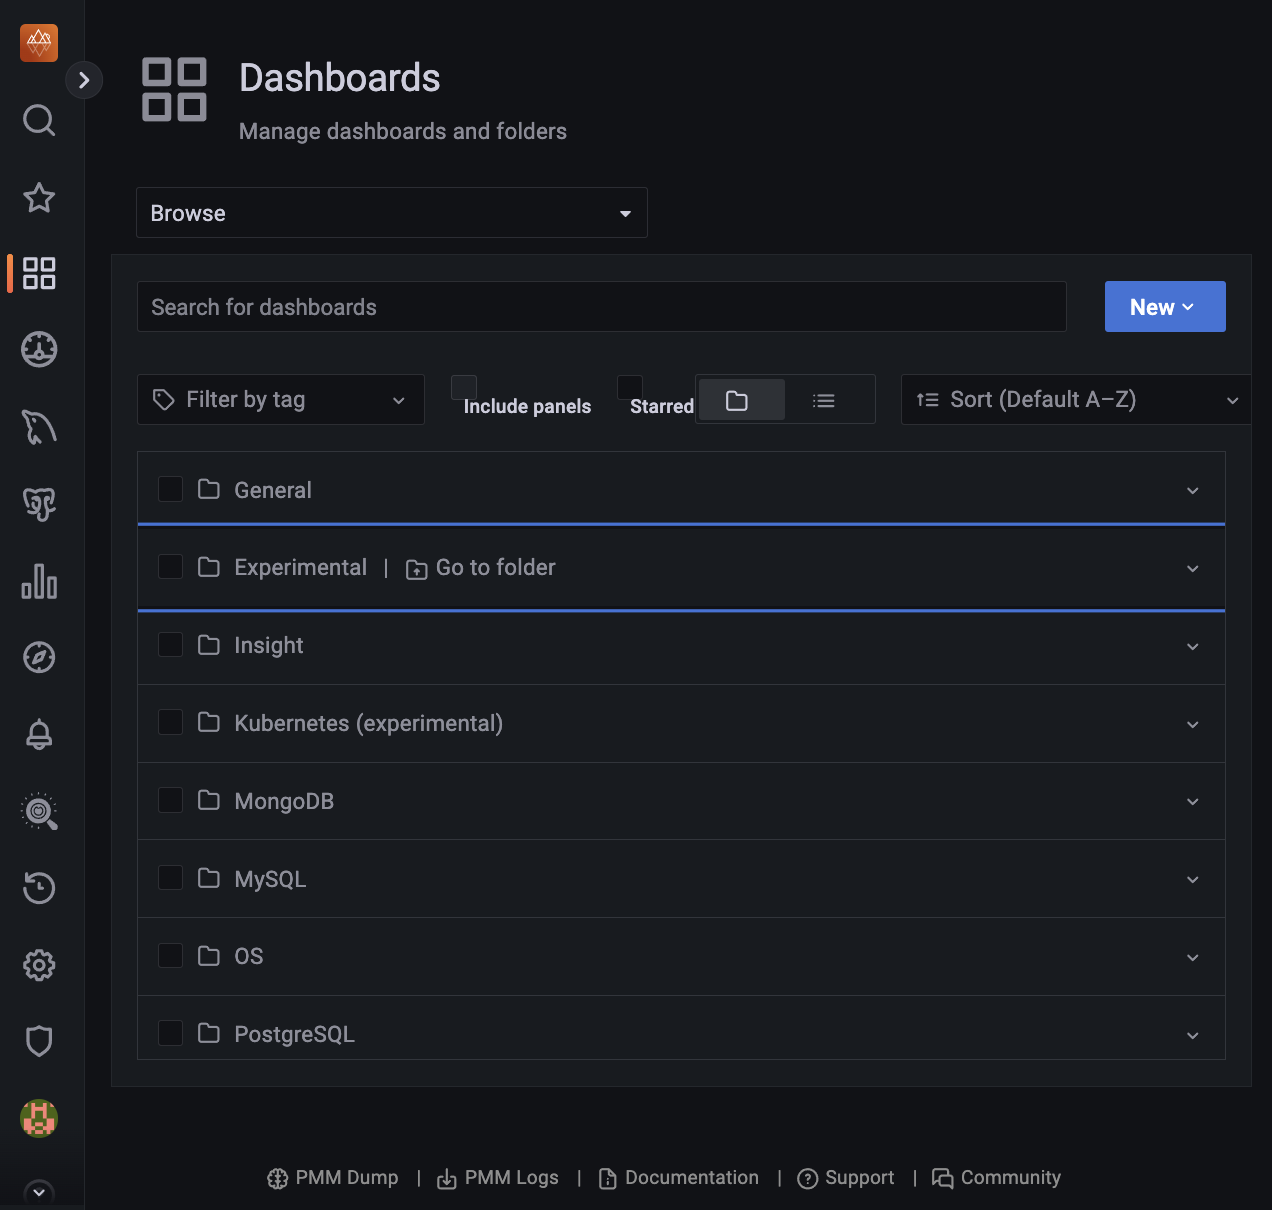
To access the experimental dashboards, go to the PMM home page and then navigate to Dashboards > Experimental from the side menu.
Alternatively, go to the PMM home page, navigate to Dashboards from the side menu, and enter the dashboard name in the Search for dashboards field.
Reworked Kubernetes dashboards
PMM 2.41.2 now features redesigned Kubernetes dashboards that offer improved clarity and usability.
- The redundant information has been removed from some of these dashboards.
- The Overview dashboard, which has now been renamed as Kubernetes Cluster Overview, has been reorganized and improved for better functionality.
- The DB Cluster dashboard has been renamed as Databases on Kubernetes and now displays dynamic information. Furthermore, it separates database/proxy details and shows resource limits.
These changes aim to improve user experience while adhering to PMM standards, particularly for managing multiple clusters.
Databases overview dashboard
The latest release introduces a new dashboard that offers a simplified overview of the databases being monitored by PMM. This dashboard aims to provide a centralized and unified place where the crucial parameters for database performance can be easily accessed.
If you're looking for more information on this dashboard, see the blog post.
PostgreSQL Instance Summary dashboard
The PostgreSQL Instance Summary dashboard is a newly designed feature that displays the critical PostgreSQL metrics. This dashboard aims to assist DBAs and developers in identifying PostgreSQL issues quickly.
PostgreSQL Checkpoints, Buffers and WAL Usage dashboard
In our continuous effort to enhance our dashboards, we have introduced this new experimental dashboard that provides more data about your PostgreSQL instances.
By leveraging this data, administrators can gain insights into their PostgreSQL servers and fine-tune their performance. Understanding and managing checkpoints, buffers, and WAL usage contribute to a well-performing and reliable PostgreSQL environment.
If you’re looking for in-depth insights into this dashboard, refer to our blog post.
PostgreSQL Patroni dashboard
Starting with PMM 2.41.2, we have included a new dashboard designed to monitor Patroni as an external service. For more information, see our documentation on external services.
This dashboard facilitates gathering more data for your PostgreSQL cluster inside PMM.
Read our blog post to learn more about this dashboard and how to add Patroni monitoring.
⚠️ Important
We would appreciate your feedback on these experimental dashboards to help us enhance it further.
Improvements
-
PMM-10974 - Starting from PMM version 2.41.2, PMM has improved its stat tracking feature. In case
pg_stat_monitoris not available, PMM will now usepg_stat_statementsas a fallback option. -
PMM-12884 - In PMM dump, the Address field on the Send to Support screen now comes with the address and port pre-filled, making it easier to send logs to support.
-
PMM-12887 - [Tech Preview] This new experimental dashboard has been added in PMM 2.41.2 for monitoring PostgreSQL checkpoints, buffers and WAL usage.
-
PMM-12888 - [Tech Preview] This new experimental dashboard has been added in PMM 2.41.2 to monitor Patroni as an external service.
-
PMM-12960 - [Tech Preview] The latest PMM release includes redesigned Kubernetes dashboards with improved clarity and usability.
-
PMM-12981 - Starting with PMM 2.41.2, PMM can now collect wraparound metrics for PostgreSQL. By monitoring these wraparound-related metrics, PostgreSQL administrators can proactively manage wraparound risks and prevent potential data corruption and downtime.
-
PMM-12894 - We have limited the number of connections used by postgres_exporter. Additionally, we have fixed an issue where connections are closed as soon as they are no longer needed, thereby preventing any hanging or idle connections.
-
PMM-12897 - Previously, two heavy queries were running for each database in the PostgreSQL server at medium resolution, which impacted the performance. These queries have now been moved to low resolution to improve performance.
Fixed issues
-
PMM-12806 - In previous versions, PMM Server used certain non-configurable Victoria Metrics settings with default values. With this release, we are updating this behavior to enable you to modify default values for Victoria Metrics settings using environment variables. Previously, environment variables were overlooked as Victoria metrics prioritized specific command line flags passed by PMM over environment variables.
-
PMM-12348 - The ClickHouse engine was updated from the ordinary engine to the Atomic engine, which is the most robust engine, after upgrading PMM to version 2.41.0.
-
PMM-12785 - Fixed an issue where VictoriaMetrics scrape configuration contained unsupported parameters.
-
PMM-12805 - While monitoring MongoDB servers, the disk space was being consumed due to the
CommandNotSupportedOnViewmessage in the logs. This issue has now been resolved. -
PMM-12809 - Fixed several CVEs in PMM versions v2.40.1 and above.
-
PMM-12852 - An internal server error was thrown while attempting to modify any setting in PMM. This issue has been resolved now.
-
PMM-12986 - The
PostgreSQL connections in usealert was triggering false positive notifications, but the issue has been resolved now. -
PMM-12948 - Fixed an issue where the wrong information was being displayed regarding the uptime of the PostgreSQL instance.
-
PMM-12997 - The
pmm-agentoutput was changed fromstdouttostderr, which caused the automation to break. The issue has been resolved now.
v2.41.1
Percona Monitoring and Management 2.41.1
| Release date | Feb 1st, 2024 |
|---|---|
| Installation | Installing Percona Monitoring and Management |
Percona Monitoring and Management (PMM) is an open source database monitoring, management, and observability solution for MySQL, PostgreSQL, and MongoDB.
It enables you to observe the health of your database systems, explore new patterns in their behavior, troubleshoot them and execute database management operations—regardless of whether your databases are located on-premises or in the cloud.
Release Highlights
Improved support for Arbiter nodes
We've made it easier to add and monitor MongoDB Arbiter nodes in PMM, as this no longer requires workarounds for cases where authorization is enabled on the MongoDB replica set. Additionally, Arbiter nodes are now displayed correctly on the dashboards:
New metric for sharded MongoDB insights
We've added a new metric to our MongoDB exporters: mongodb_shards_collection_chunks_count. This metric is available for sharded Mongo instances, offering insights into the distribution of collection chunks across different shards.
While this version is not currently integrated into any dashboard, you have the flexibility to incorporate it into your custom dashboards. For comprehensive instructions on managing dashboards, check out this video tutorial and the documentation.
New experimental MongoDB Instance Summary dashboard
This release also introduces a new MongoDB dashboard that offers a simplified view of the most critical MongoDB metrics. You can find the new MongoDB Instance Summary dashboard in the Experimental folder of your PMM installation. This dashboard is currently in Technical preview so we encourage you to evaluate its performance with your MongoDB instance and share your valuable feedback on our forum.
Improvements
- PMM-12390 - [Backup Management]: The Service name field on the Create Backup pages is now case-insensitive, allowing for more comprehensive and accurate results retrieval.
- PMM-12712 - MongoDB sharded cluster metrics now include a new metric to represent database and collection distribution across different shards. This helps gain insights into the overall balance of shards within MongoDB setups.
- PMM-12510 - Improved workflow for adding MongoDB Arbiter nodes to PMM, which also ensures that Arbiter nodes are now displayed correctly on the dashboards.
- PMM-12750 - [Dashboards]: Introduced an experimental MongoDB Instance Summary dashboard to provide a rapid overview of key MongoDB metrics.
- PMM-12866 - [Dashboards]: Minor UX improvements to the K8s experimental dashboard (Tech Preview).
Bugs Fixed
- PMM-12652 - Fixed issue where PMM failed to start after an upgrade, due to SELinux restrictions on accessing a PMM file created with root ownership on Podman. This fix applies to upgrades from PMM 2.41.0 to newer versions.
- PMM-9825 - [QAN]: PostgreSQL databases, monitored using the pg_stat_monitor extension v2.0+, were previously displayed with User IDs rather than actual User Names in the Service Name column on the Query Analytics (QAN) page. This issue is now fixed.
- PMM-12290 - [QAN]: Fixed bugs with SQL comments parsed in queries when they were not intentionally enabled for remotely added PostgreSQL and MySQL.
- PMM-12621 - [Dashboards]: Added support for the Anonymous mode to show all Service types on the main menu. This ensures users can access the dashboards, even when PMM is configured in Anonymous mode.
- PMM-12425 - [QAN]: The Absolute time range time picker on the Query Analytics (QAN) page no longer displays an error when using 'now' instead of a specific timestamp for filtering dashboard data.
- PMM-12473 - Fixed monitoring of external services when query string parameters are passed to
--metrics-path. - PMM-9407 - Fixed missing custom
queries.yamlfile for medium-resolution in Debian packages for PostgreSQL. - PMM-12350 - Fixed issue of flood logs in
mongod_exporterwhen connected to Mongos. - PMM-12738 - Fixed issue that prevented PMM from running when using Helm with customer certificates.
- PMM-12781 - Corrected a permission error that was flooding PostgreSQL logs by ensuring proper execution permissions for the
pg_ls_waldirfunction.
v2.41.0
Percona Monitoring and Management 2.41.0
| Release date | Dec 12, 2023 |
|---|---|
| Installation | Installing Percona Monitoring and Management |
Percona Monitoring and Management (PMM) is an open source database monitoring, management, and observability solution for MySQL, PostgreSQL, and MongoDB.
Release Highlights
Streamlined database problem reporting to Percona
To improve the gathering and sharing of PMM metrics and data, we’ve now integrated the pmm_dump client utility into PMM. Initially a standalone client for PMM Server, PMM Dump is now accessible in the PMM user interface.
This integration enables you to collect PMM data to share with our Support team.
To get started, in the main menu, go to Help > PMM Dump and select either to export a dataset locally or upload it to our SFTP servers using the credentials generated through your Percona Support ticket.
PostgreSQL monitoring: optimizing performance
PMM 2.41.0 introduces limit for Auto-discovery in PostgreSQL, a feature that dynamically discovers all databases in your PostgreSQL instance. Limiting Auto-discovery reduces connections and prevents high CPU and RAM usage caused by multiple databases, thus optimizing performance.
For details, see documentation.
PMM DBaaS functionality evolution into Percona Everest
We have decided to separate our DBaaS offering into an independent product. Consequently, we are discontinuing the DBaaS functionality in PMM and offering a migration path to Everest.
While the DBaaS functionality will remain available in PMM versions 2.x, all future updates and enhancements will be exclusively accessible through the Percona Everest interface.
For a more streamlined and robust database deployment experience, try Percona Everest.
Technical Preview of PMM in high availability (HA) mode
⚠️ Important
Disclaimer: This feature has been added in PMM 2.41.0 and is currently in Technical Preview. Early adopters are advised to use this feature for testing purposes only as it is subject to change.
Starting with this release, PMM can now be run in high availability mode with several PMM server applications and independent data sources.
Currently, PMM servers provide high availability, but users are responsible for maintaining the high availability of the data sources used by PMM.
These data sources are:
- ClickHouse: An open-source, fast analytical database.
- VictoriaMetrics: A scalable, long-term storage solution for time series data.
- PostgreSQL: A powerful open-source relational database management system used in this setup to store PMM data like inventory, settings, and other feature-related data.
If you're looking to dive deep into this feature, see our comprehensive documentation.
New Features
- PMM-12459 - The pmm_dump client utility previously available as a standalone client for PMM Server is now readily accessible within the PMM user interface.
Improvements
- PMM-11341 - PMM 2.41.0 introduces limit for Auto-discovery in PostgreSQL, a feature that dynamically discovers all databases in your PostgreSQL instance. Limiting Auto-discovery reduces connections and prevents high CPU and RAM usage caused by multiple databases, thus optimizing performance.
- PMM-12375 - Starting with PMM 2.41.0, each instance of a service gets a
versionattribute in the PMM Inventory UI. - PMM-12422 - PMM 2.41.0 introduces a new flag called
--expose-exporter. When you enable this flag any IP address, either from a local system or from anywhere on the internet, can access exporter endpoints. If the flag is not enabled, the exporter will be available only locally. - PMM-12544 - Added deprecation notices to the PMM documentation DBaaS pages. For a more streamlined and robust database deployment experience, try Percona Everest.
- PMM-12549 - Added support for the latest MongoDB version. You can now use PMM to monitor MongoDB 7 databases.
Components upgrade
- PMM-12154 - Updated
postgres_exporterto version 0.14.0. With this update, we have resolved several performance issues and eliminated the creation of multiple connections per database. - PMM-12223 - Clickhouse has been updated to version 23.8.2.7, which optimizes memory and CPU usage to improve system performance.
Bugs Fixed
- PMM-4712 - We have addressed the issue where the pprof heap reports for postgres_exporter were missing.
- PMM-12626 - Due to the packages being built on an outdated Go version, there was a potential vulnerability. We have updated Go to the latest version to mitigate this risk.
- PMM-12414 - Fixed an issue with an unexpected behavior (502 response) when accessing the
logs.zipendpoint. This was caused by thegroup_byparameter being included in the Alertmanager configuration. Additionally, we removed AlertManager-related files fromlogs.zipsince we stopped using AlertManager. - PMM-11714 - Registering a node with the Grafana Admin flag enabled but a non-admin role was failing. This issue has now been resolved.
- PMM-12660 - Prior to version 2.41.0 of PMM, the endpoint
/v1/management/Agent/Listcould deliver database certificates to the PMM UI, allowing an authenticated admin user to view the output of TLS certificates. This posed a security issue since certificates should be consumed by the backend only. We have resolved this issue now. - PMM-12630 - When users attempted to upgrade PMM versions lower than or equal to 2.37.1, the upgrade process got stuck in a loop and failed. The issue has been resolved now.
- PMM-12725 - Fixed the pagination for QAN.
- PMM-12658 - Corrected a typo in the MongoDB cluster summary dashboard.
v2.40.1
Percona Monitoring and Management 2.40.1
| Release date: | Oct 20, 2023 |
|---|---|
| Installation: | Installing Percona Monitoring and Management |
Percona Monitoring and Management (PMM) is an open-source database monitoring, management, and observability solution for MySQL, PostgreSQL, and MongoDB.
Fixed issues
- PMM-12592 - Fixed an issue where the Library Panels for the PMM dashboard were not working after upgrade to PMM 2.40.0.
- PMM-12576 - After upgrading to PMM 2.40.0, changing the Admin user's password from the terminal was not functioning. The issue has been resolved now.
- PMM-12587 - After upgrading to PMM 2.40.0, some users may experience incorrect mappings between dashboards, folders, users, and groups. This can result in either a successful upgrade or a
500 internal server error. The issue has now been resolved. - PMM-12590 CVE-2023-4911 is a vulnerability in the base OS that PMM is based on. It has been fixed in the base OS, and the fix is available in PMM.
How to upgrade to PMM 2.40.1
For instructions on upgrading to PMM 2.40.1 and mitigating issues from PMM 2.40.0, follow the steps below:
-
Copy the file from
/srv/backup/grafana/grafana.dbto/srv/grafana/grafana.dbdocker exec -t pmm-server cp /srv/backup/grafana/grafana.db /srv/grafana/grafana.db -
Set permissions:
chmod 640 /srv/grafana/grafana.db

chown grafana:grafana /srv/grafana/grafana.db
-
Upgrade to 2.40.1 as usual.
