This tutorial is from the Hortonworks Sandbox - a single-node Hadoop cluster running in a virtual machine. Download to run this and other tutorials in the series.
This tutorial describes how to load data into the Hortonworks sandbox.
The Hortonworks sandbox is a fully contained Hortonworks Data Platform (HDP) environment. The sandbox includes the core Hadoop components (HDFS and MapReduce), as well as all the tools needed for data ingestion and processing. You can access and analyze sandbox data with many Business Intelligence (BI) applications.
In this tutorial, we will load and review data for a fictitious web retail store in what has become an established use case for Hadoop: deriving insights from large data sources such as web logs. By combining web logs with more traditional customer data, we can better understand our customers, and also understand how to optimize future promotions and advertising.
- Hortonworks ODBC driver installed and configured
- Hortonworks Sandbox 1.3 (installed and running)
To load data into the Hortonworks sandbox, you will:
- Download sample data to your computer.
- Upload the data files into the sandbox
- View and refine the data in the sandbox.
-
You can download a set of sample data contained in a compressed (.zip) folder here:
-
Save the sample data .zip file to your computer, then extract the files.
Note: The extracted data files should have a .tsv.gz file extension. If you download the files using a browser, the file extension may change to .tsv.gz.tsv. If this happens, change the file extensions back to .tsv.gz before uploading the files into the sandbox.
-
In the Hortonworks Sandbox, click the HCat icon to open the HCatalog page, then click Create a new table from a file.

-
On the “Create a new table from a file” page, type “omniturelogs” in the Table Name box, then click Choose a file.

-
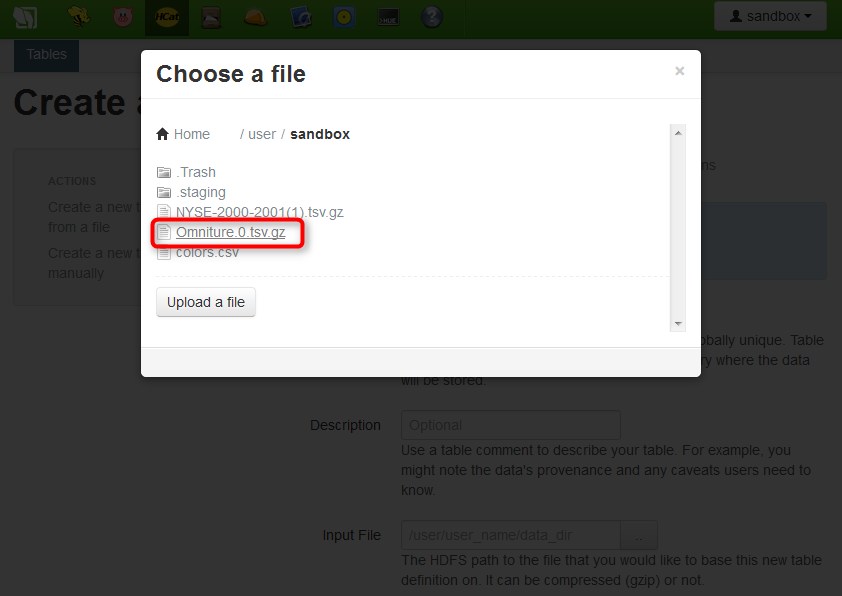
On the "Choose a file" pop-up, click Upload a file to display a file browser.

-
Use the file browser to select the Omniture.0.tsv.gz file, then click Open.

-
After you select the select the Omniture.0.tsv.gz file, it appears in the list on the "Choose a file" pop-up. Click the file name to select the Omniture.0.tsv.gz file.

-
The "Create a new table from a file" page is redisplayed with the Omniture.0.tsv.gz in the Input File box.

-
Clear the check box next to “Read column headers” to create the table using default column names (col_1, col_2, etc.).

-
Scroll down to the bottom of the page and click Create Table. A progress indicator will appear at the top of the page while the table is being created.

-
After the table is created, the "omniturelogs" table appears in the list on the HCatalog page.

-
Repeat this procedure for the users.tsv.gz file using the table name “users,” and for the products.tsv.gz using the table name “products.” When creating these tables, leave the “Read column headers” check box selected to create the tables using the first row as the column names.


In the previous section, we created sandbox tables from uploaded data files. Now let’s take a closer look at that data.
Here’s a summary of the data we’re working with:
-
omniturelogs– website logs containing information such as URL, timestamp, IP address, geocoded IP, and session ID. -
users– CRM user data listing SWIDs (Software User IDs) along with date of birth and gender. -
products– CMS data that maps product categories to website URLs. -
Let’s start by looking at the raw omniture data. Click the File Browser icon in the toolbar at the top of the page, then select the
Omniture.0.tsv.gzfile.
-
The raw data file appears in the File Browser, and you can see that it contains information such as URL, timestamp, IP address, geocoded IP, and session ID.

-
Now let’s look at the "users" table using HCatalog. Click the HCat icon in the toolbar at the top of the page, then click Browse Data in the "users" row.

-
The "users" table appears, and you can see the SWID, birth date, and gender columns.

-
You can also use HCatalog to view the data in the "products" table, which maps product categories to website URLs.


Now let’s use a Hive script to generate an “omniture” view that contains a subset of the data in the Omniture log table. Click the Beeswax (Hive UI) icon in the toolbar at the top of the page to display the Query Editor, then paste the following text in the Query box:
CREATE VIEW omniture AS
SELECT
  col_2 ts,
  col_8 ip,
  col_13 url,
  col_14 swid,
  col_50 city,
  col_51 country,
  col_53 state
from omniturelogs

-
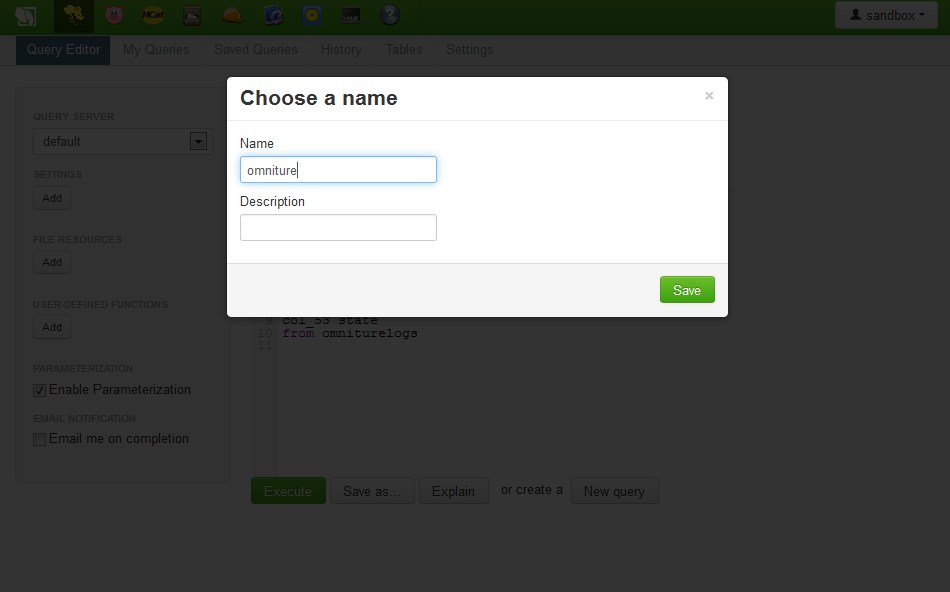
Click Save as. On the "Choose a Name" pop-up, type “omniture” in the Name box, then click Save.

-
Click Execute to run the script.

-
To view the data generated by the saved script, click Tables in the menu at the top of the page, select the checkbox next to “omniture,” then click Browse Data.


- The query results will appear, and you can see that the results include the data from the omniturelogs table that were specified in the query.

Finally, we’ll create a script that joins the omniture website log data to the CRM data (registered users) and CMS data (products). Click Query Editor, then paste the following text in the Query box:
create table webloganalytics as

        select
            to_date(o.ts) logdate,
            o.url,
            o.ip,
            o.city,
            upper(o.state) state,
            o.country,
            p.category,
            CAST(datediff(
            from_unixtime( unix_timestamp() ),
            from_unixtime( unix_timestamp(u.birth_dt, 'dd-MMM-yy'))) / 365  AS INT) age,
              u.gender_cd gender
              from
              omniture o
              inner join products p on o.url = p.url
              left outer join users u on o.swid = concat('{', u.swid , '}')
- Save this script as “webloganalytics” and execute the script. You can view the data generated by the script as described in the preceding steps.
Now that you have loaded data into the Hortonworks Platform, you can use Business Intelligence (BI) applications such as Microsoft Excel to access and analyze the data.