You signed in with another tab or window. Reload to refresh your session.You signed out in another tab or window. Reload to refresh your session.You switched accounts on another tab or window. Reload to refresh your session.Dismiss alert
I was trying to use your model on my own dataset to do the feature selection. Since I don't have access to the dataset you described in the paper, I used the Boston dataset in your repo. But I found that the feature importance scores calculated by the norm of weights are not consistent across the 5-folds, as well as not consistent across the models (HorseshoeBNN and LinearHorseshoe).
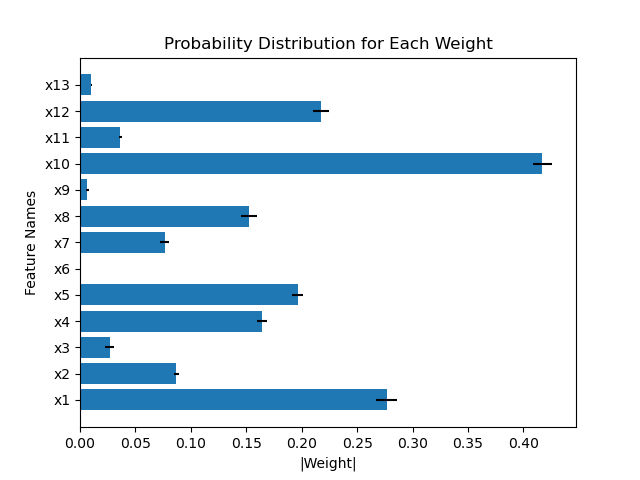
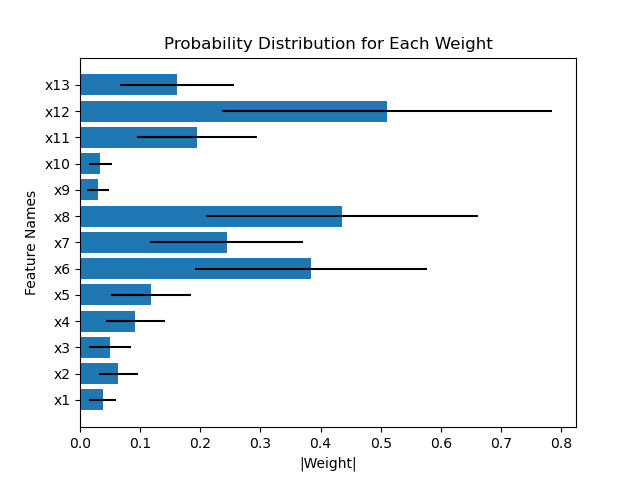
For example, comparing the weights of the first layer between HorseshoeBNN and LinearHorseshoe for the first fold of train-test-split (which means they are trained using the same dataset):
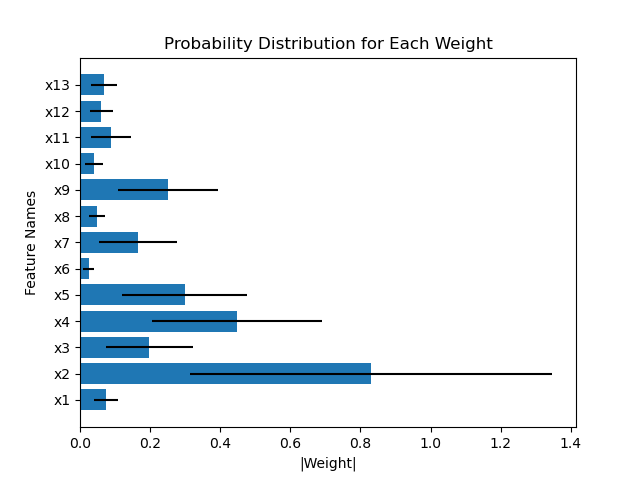
Another example compares the weights of the first layer of HorseshoeBNN between the first and second fold of train-test-split:
However, Figure 8 in the paper shows that the weight distributions are very consistent as least between HorseshoeBNN and LinearHorseshoe. I was wondering if I'm doing anything wrong with plotting the weight distributions. Basically I just sample the beta, tau, and v from the first Horseshoe layer and multiply them together according to weights = beta * tau * v, and calculate the mean and std for the weights. My code for plotting the norm of weights as the feature importance scores is attached:
def plot_weights_dist(means: np.ndarray, variances: np.ndarray, feature_names: list) -> None:
    y_pos = np.arange(len(feature_names))
    fig, ax = plt.subplots()
    ax.barh(y_pos, np.abs(means), xerr=variances)
    ax.set_xlabel('|Weight|')
    ax.set_ylabel('Feature Names')
    plt.yticks(y_pos, feature_names)
    plt.title("Probability Distribution for Each Weight")
    plt.show()

feature_names = ["x1", "x2", "x3", "x4", "x5", "x6", "x7", "x8", "x9", "x10", "x11", "x12", "x13"]
n_samples = config['n_samples_testing']
beta = model.l1.beta.sample(n_samples) # for HorseshoeBNN use model.l1, for LinearHorseshoe use model.layer, the same to the next two line
log_tau = torch.unsqueeze(model.l1.log_tau.sample(n_samples), 1)
log_v = torch.unsqueeze(model.l1.log_v.sample(n_samples), 1)
weight = beta * log_tau * log_v
weight = weight.reshape(-1, weight.shape[-1])
plot_weights_dist(torch.mean(torch.abs(weight), dim=0).cpu().detach().numpy(),
                  torch.std(torch.abs(weight), dim=0).cpu().detach().numpy(),
                  feature_names)
The text was updated successfully, but these errors were encountered:
Hi,
I was trying to use your model on my own dataset to do the feature selection. Since I don't have access to the dataset you described in the paper, I used the Boston dataset in your repo. But I found that the feature importance scores calculated by the norm of weights are not consistent across the 5-folds, as well as not consistent across the models (HorseshoeBNN and LinearHorseshoe).
For example, comparing the weights of the first layer between HorseshoeBNN and LinearHorseshoe for the first fold of train-test-split (which means they are trained using the same dataset):

Another example compares the weights of the first layer of HorseshoeBNN between the first and second fold of train-test-split:
However, Figure 8 in the paper shows that the weight distributions are very consistent as least between HorseshoeBNN and LinearHorseshoe. I was wondering if I'm doing anything wrong with plotting the weight distributions. Basically I just sample the beta, tau, and v from the first Horseshoe layer and multiply them together according to weights = beta * tau * v, and calculate the mean and std for the weights. My code for plotting the norm of weights as the feature importance scores is attached:
The text was updated successfully, but these errors were encountered: