Your ability to monitor the health of your systems and applications relies on your ability to create and maintain the best set of alarms for your particular needs.
In v1.18 of Netdata, we introduced dimension templates for alarms, which simplifies the process of writing alarm entities for charts with many dimensions.
Dimension templates can condense many individual entities into one—no more copy-pasting one entity and changing the
alarm/template and lookup lines for each dimension you'd like to monitor.
They are, however, an advanced health monitoring feature. For more basic instructions on creating your first alarm, check out our health monitoring documentation, which also includes examples.
Our dimension templates update creates a new foreach parameter to the existing lookup
line. This is where the magic happens.
You use the foreach parameter to specify which dimensions you want to monitor with this single alarm. You can separate
them with a comma (,) or a pipe (|). You can also use a Netdata simple pattern
to create many alarms with a regex-like syntax.
The foreach parameter has to be the last parameter in your lookup line, and if you have both of and foreach in
the same lookup line, Netdata will ignore the of parameter and use foreach instead.
Let's get into some examples so you can see how the new parameter works.
⚠️ The following entities are examples to showcase the functionality and syntax of dimension templates. They are not meant to be run as-is on production systems.
Let's say you want to monitor the system, user, and nice dimensions in your system's overall CPU utilization.
Before dimension templates, you would need the following three entities:
 alarm: cpu_system
    on: system.cpu
lookup: average -10m percentage of system
 every: 1m
  warn: $this > 50
  crit: $this > 80

 alarm: cpu_user
    on: system.cpu
lookup: average -10m percentage of user
 every: 1m
  warn: $this > 50
  crit: $this > 80

 alarm: cpu_nice
    on: system.cpu
lookup: average -10m percentage of nice
 every: 1m
  warn: $this > 50
  crit: $this > 80
With dimension templates, you can condense these into a single alarm. Take note of the alarm and lookup lines.
 alarm: cpu_template
    on: system.cpu
lookup: average -10m percentage foreach system,user,nice
 every: 1m
  warn: $this > 50
  crit: $this > 80
The alarm line specifies the naming scheme Netdata will use. You can use whatever naming scheme you'd like, with .
and _ being the only allowed symbols.
The lookup line has changed from of to foreach, and we're now passing three dimensions.
In this example, Netdata will create three alarms with the names cpu_template_system, cpu_template_user, and
cpu_template_nice. Every minute, each alarm will use the same database query to calculate the average CPU usage for
the system, user, and nice dimensions over the last 10 minutes and send out alarms if necessary.
You can find these three alarms active by clicking on the Alarms button in the top navigation, and then clicking on the All tab and scrolling to the system - cpu collapsible section.
Let's look at some other examples of how foreach works so you can best apply it in your configurations.
In the last example, we used foreach system,user,nice to create three distinct alarms using dimension templates. But
what if you want to quickly create alarms for all the dimensions of a given chart?
Use a simple pattern! One example of a simple pattern is a single wildcard
(*).
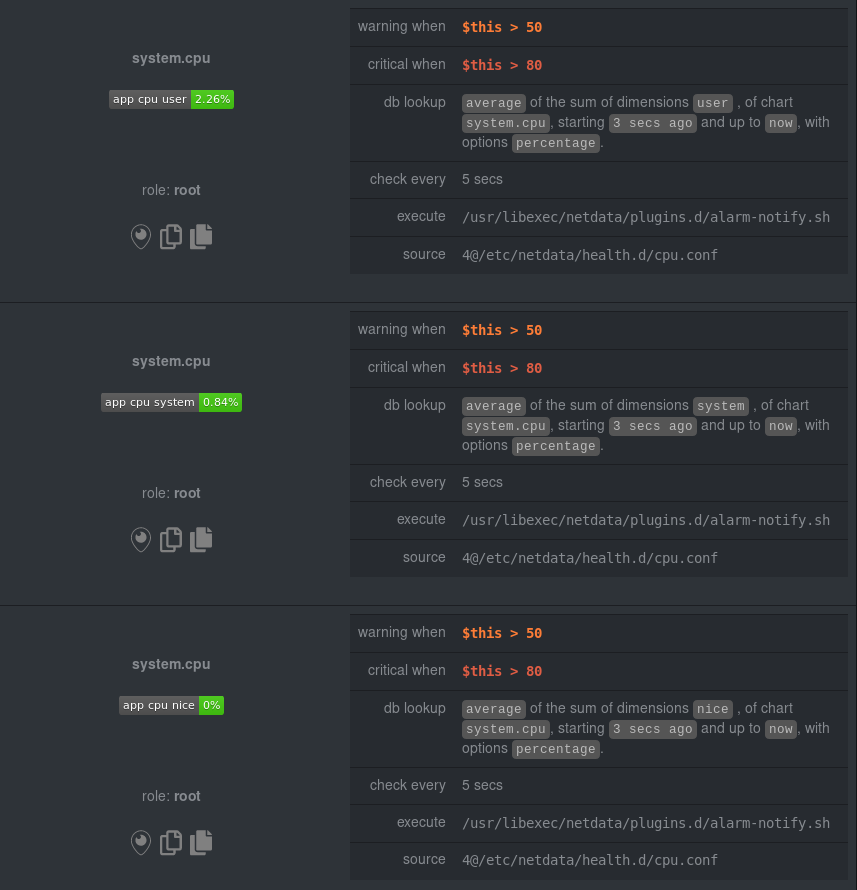
Instead of monitoring system CPU usage, let's monitor per-application CPU usage using the apps.cpu chart. Passing a
wildcard as the simple pattern tells Netdata to create a separate alarm for every process on your system:
 alarm: app_cpu
    on: apps.cpu
lookup: average -10m percentage foreach *
 every: 1m
  warn: $this > 50
  crit: $this > 80
This entity will now create alarms for every dimension in the apps.cpu chart. Given that most apps.cpu charts have
10 or more dimensions, using the wildcard ensures you catch every CPU-hogging process.
To learn more about how to use simple patterns with dimension templates, see our simple patterns documentation.
Dimension templates also work with alarm templates. Alarm templates help you create alarms for all the charts with a given context—for example, all the cores of your system's CPU.
By combining the two, you can create dozens of individual alarms with a single template entity. Here's how you would
create alarms for the system, user, and nice dimensions for every chart in the cpu.cpu context—or, in other
words, every CPU core.
template: cpu_template
      on: cpu.cpu
  lookup: average -10m percentage foreach system,user,nice
   every: 1m
    warn: $this > 50
    crit: $this > 80
On a system with a 6-core, 12-thread Ryzen 5 1600 CPU, this one entity creates alarms on the following charts and dimensions:
cpu.cpu0cpu_template_usercpu_template_systemcpu_template_nice
cpu.cpu1cpu_template_usercpu_template_systemcpu_template_nice
cpu.cpu2cpu_template_usercpu_template_systemcpu_template_nice
- ...
cpu.cpu11cpu_template_usercpu_template_systemcpu_template_nice
And how just a few of those dimension template-generated alarms look like in the Netdata dashboard.
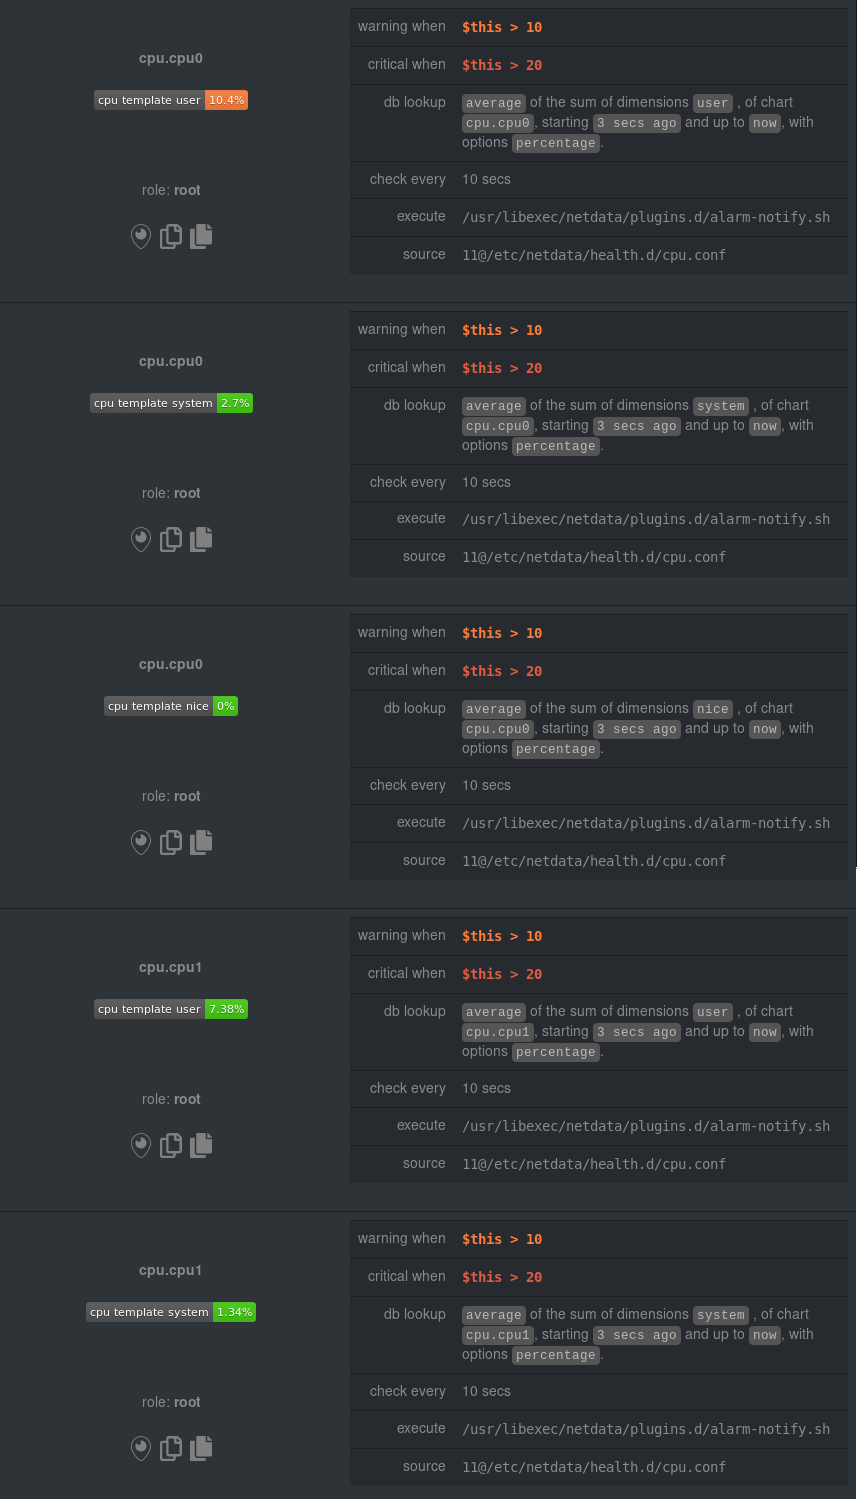
All in all, this single entity creates 36 individual alarms. Much easier than writing 36 separate entities in your health configuration files!
We hope you're excited about the possibilities of using dimension templates! Maybe they'll inspire you to build new alarms that will help you better monitor the health of your systems.
Or, at the very least, simplify your configuration files.
For information about other advanced features in Netdata's health monitoring toolkit, check out our health documentation. And if you have some cool alarms you built using dimension templates,